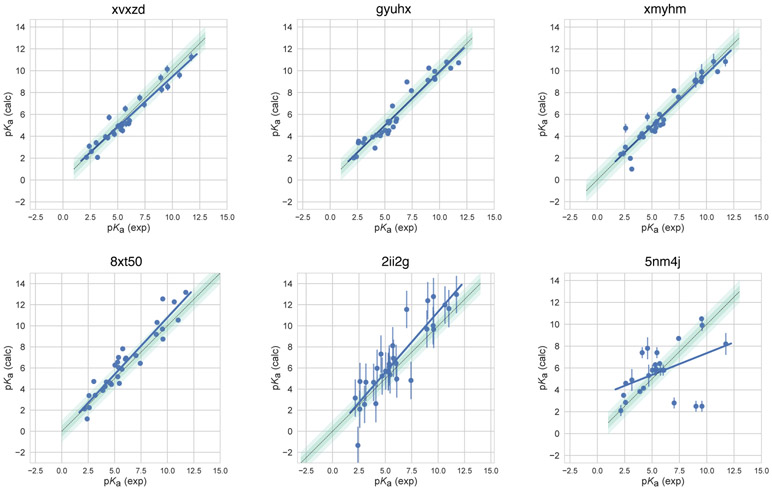
Figure 4. Predicted vs. experimental macroscopic pKa prediction for four consistently well-performing methods, a representative method with average performance (2ii2g), and the null method (5nm4j).
When submissions were ranked according to RMSE, MAE, R2, and τ, four methods ranked in the Top 10 consistently in each of these metrics. Dark and light green shaded areas indicate 0.5 and 1.0 units of error. Error bars indicate standard error of the mean of predicted and experimental values. Experimental pKa SEM values are too small to be seen under the data points. EC-RISM/MP2/cc-pVTZ-P2-q-noThiols-2par method (2ii2g) was selected as the representative method with average performance because it is the method with the highest RMSE below the median.

