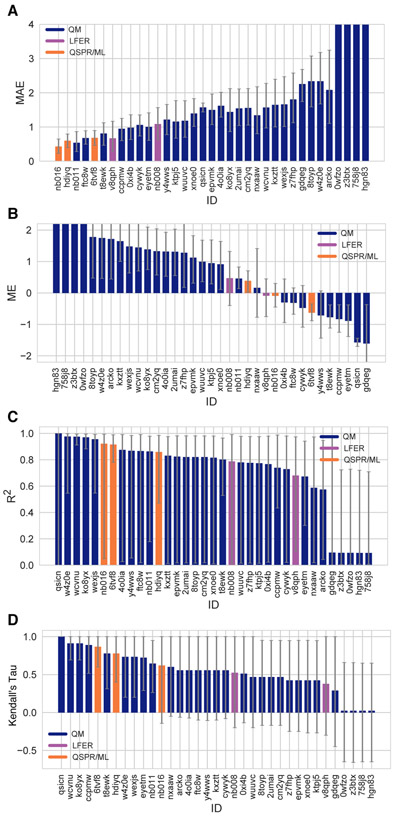
Figure 9. Additional performance statistics for microscopic pKa predictions for 8 molecules with experimentally determined dominant microstates.
Microstate-based matching was performed between experimental pKa values and predicted microscopic pKa values. Mean absolute error (MAE), mean error (ME), Pearson’s R2, and Kendall’s Rank Correlation Coefficient Tau (τ) are shown, with error bars denoting 95% confidence intervals obtained by bootstrapping over challenge molecules. Methods are indicated by their submission IDs. Submissions are colored by their method categories. Refer to Table 1 for submission IDs and method names. Submissions 0wfzo, z3btx, 758j8, and hgn83 have MAE and ME values bigger than 10 pKa units which are beyond the y-axis limits of subplots A and B. A large number and wide variety of methods have statistically indistinguishable performance based on correlation statistics (C and D), in part because of the relatively small dynamic range and small size of the set of 8 molecules.

