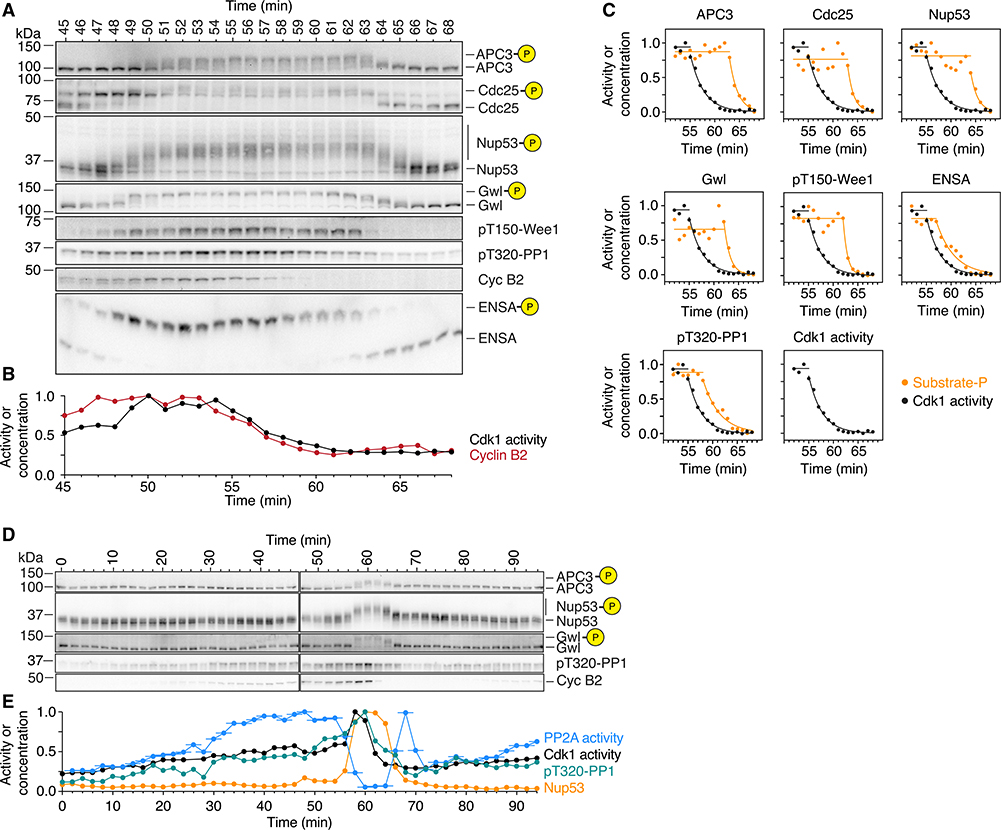
Figure 7. PP2A-B55 Activity Peaks prior to Mitotic Entry and during Mitotic Exit.
(A–C) Phosphorylation and dephosphorylation of Cdk1 substrates show a distinct time lag compared to the increase and decrease in cyclin B concentration and Cdk1 activity. The changes in Cdk1 activity (B and C; mean of a technical duplicate), cyclin B2 concentration (A and C), and the phosphorylation of several substrates (B) were measured with high temporal resolution in a cycling extract progressing through mitosis. Note that cyclin B2 and Cdk1 activity are minimal at 61 min whereas most substrates are still hyperphosphorylated (B and C; for Cdk1 activity and the phosphospecies [as a fraction of total signal], exponential decays were fitted to the declining part of the time course).
(D and E) PP2A-B55 activity peaks prior to mitotic entry and during mitotic exit. The phosphorylation of two mitotic substrates (D; quantification for Nup53 and PP1 T320 is shown in E in orange and green, respectively) as well as the concentration of cyclin B2 (D) and the activity of Cdk1 and PP2A-B55 (E; black and blue, respectively) were measured in a cycling extract progressing through mitosis. For the PP2A-B55 measurements, the assays were carried out on undiluted extracts; thus, the PP2A-B55 activity could be changing during the 3 min the phosphatase assay is performed. Accordingly, we have plotted the time of each PP2A-B55 measurement as the middle of this incubation period and show the range of the assay time as a horizontal line. Note that in contrast to PP2A-B55 activity, PP1 T320 phosphorylation closely follows the activity of Cdk1 (D and E).
An additional independent experiment is shown in Figures S5A, S5B, S6, and S7.

