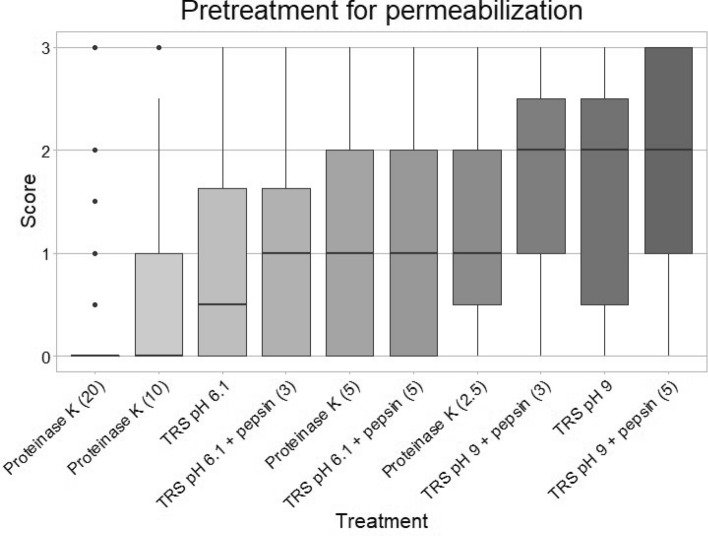
Figure 2.
Boxplot of score distribution according to pretreatment of formalin-fixed paraffin-embedded tissues. Choice of pretreatment for permeabilization: Heat-induced microRNA Retrieval in Target Retrieval Solution (TRS) pH 6.1, TRS pH 9 or proteolysis with proteinase K. Exposure time for proteolysis treatment is given in minutes and presented in (). All scores are given regardless of tissue type, hence revealing the overall score of probe-staining effectivity. The x-axis shows type of treatment. The y-axis shows the mean score of the probe staining on a scale from 0 to 3, where 0 = no staining of the probe, and 3 is strong staining of the probe. The darker the color, the better the staining. The figure was constructed with the statistical software R.

