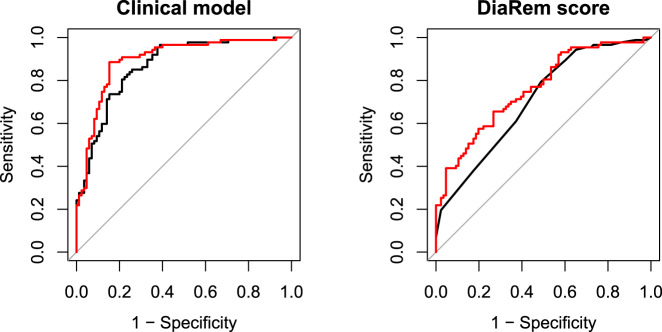
Fig. 2. Receiver operating characteristic (ROC) curves for clinical models alone (black) or with significant metabolite factors (red).
Factor 14 (betaine and choline) and factor 2 (BCAA, tyrosine, phenylalanine, methionine, arginine and histidine). On the left, the black line shows the ROC curve for a clinical model including baseline HbA1c level, insulin use, number of non-insulin type 2 diabetes medications, and weight change 2 years post-intervention. On the right, the black line shows the ROC curve for the DiaRem score.

