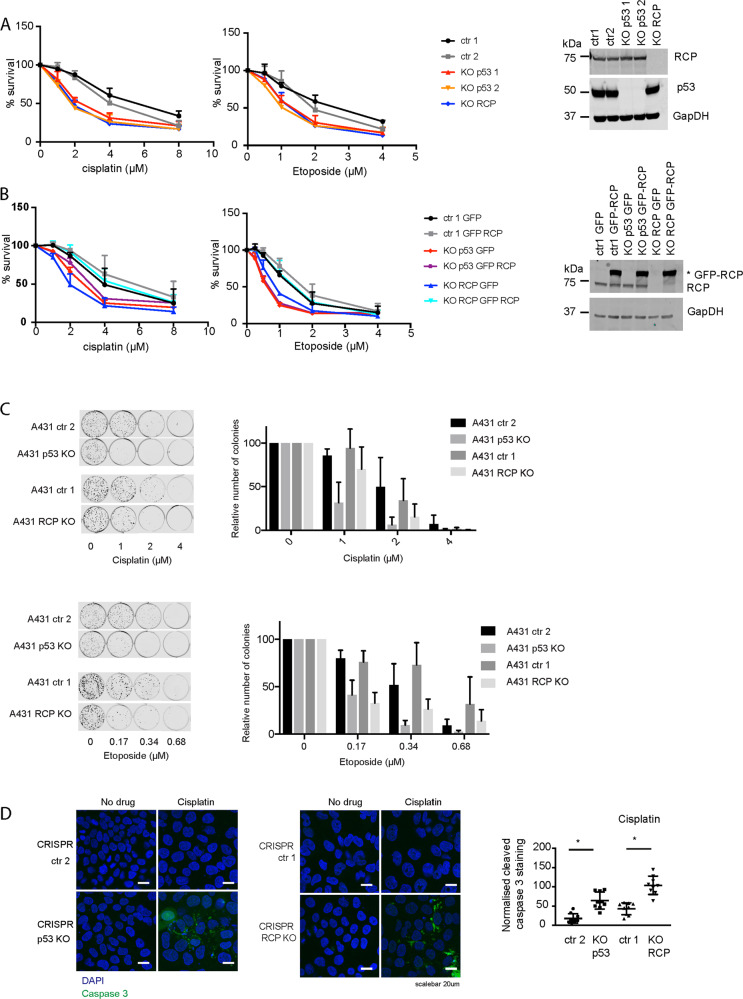
Fig. 1. Chemoresistance in A431 cells is dependent on RCP and mutant p53 expression.
A Resazurin survival assay of two different ctr A431 cells, two different p53 KO cells and RCP KO A431 cells in response to increasing doses of cisplatin and etoposide, measured after 96 h. Statistical differences were measured using a paired two-way ANOVA corrected for multiple testing (two-sided) and IC50 values were measured using a linear regression analysis. IC50 and P-values can be found in Supplemental Tables 1 and 2. Error bars indicate SD of average values of three independent experiments with three technical repeats each. Western blot panels are shown on the right incubated for RCP, p53 and GAPDH as loading control. B Resazurin survival assay of ctr, p53 KO cells and RCP KO A431 cells that were selected for GFP or GFP-RCP expression upon transfection. Survival was measured 72 h after increasing doses of cisplatin of etoposide, measured after 96 h. Statistical differences were measured using a paired two-way ANOVA corrected for multiple testing (two-sided) and IC50 values were measured using a linear regression analysis. IC50 and P-values can be found in Supplemental Tables 3 and 4. Error bars indicate SD of average values of three independent experiments with three technical repeats each. GFP-RCP expression was verified using western blot (right panels) using RCP and GAPDH as loading control. C A431 ctr1 and ctr2, p53 KO and RCP KO cells were treated with increasing amounts of cisplatin (top) or etoposide (bottom), allowed to grow in colonies (left panel) and quantified (right panel). Statistical differences were measured using a paired two-way ANOVA corrected for multiple testing (2-sided). P-values can be found in Supplemental Table 5. Error bars indicate SD of average values of three independent experiments with three technical repeats each. D Immunofluorescence and confocal imaging of cleaved caspase 3 (CC3) in A431 ctr1 and ctr2, RCP KO and p53 KO cells upon treatment with cisplatin for 48 h (4 µM). Automated quantification of CC3 staining per DAPI measured using fluorescence microscopy is shown on the right in a box and whiskers plot, with mean values indicated. Error bars indicate SD of three independent experiments. * Indicates statistical significance tested using a t-test, two-sided P < 0.0001 for both.

