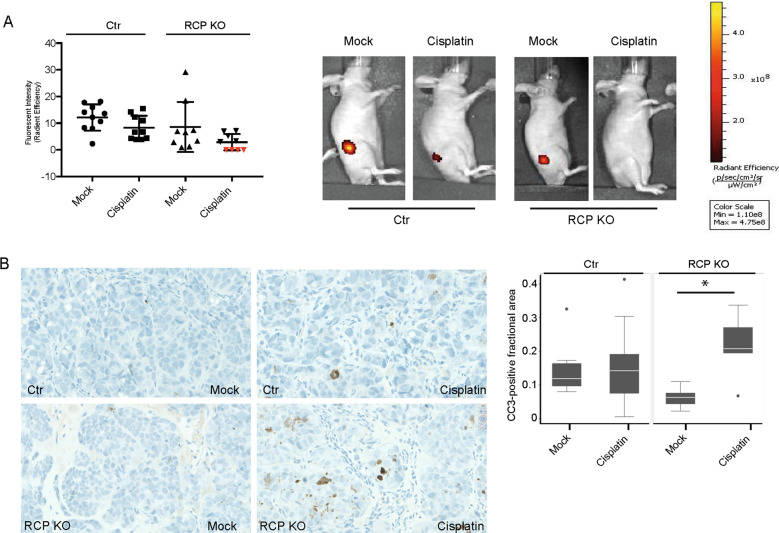
Fig. 2. RCP KO cells are more sensitive to cisplatin in vivo.
A mCherry-expressing A431 control and A431 RCP KO cells were injected subcutaneously and treated with cisplatin (cisplatin 5 mg/kg, intraperitoneally) or a vehicle control. The tumour size was inferred using fluorescence and quantified using the IVIS software. Error bars indicate SD. Red triangles indicate no measured signal and therefore measurements were set to 0. Representative images of iRFP signals in mice are shown in the right panels. B Cleaved caspase-3-positive areas were determined in each tumour and representative images are shown in the left panels, and plotted for each group in the right panel. Error bars indicate SD and * indicates a statistically significant difference (P = 0.01). Differences between growth rates and fractional cleaved caspase-positive areas were assessed by Mann-Whitney two-sample statistic with Stata SE 13.1. Scale: 40X.

