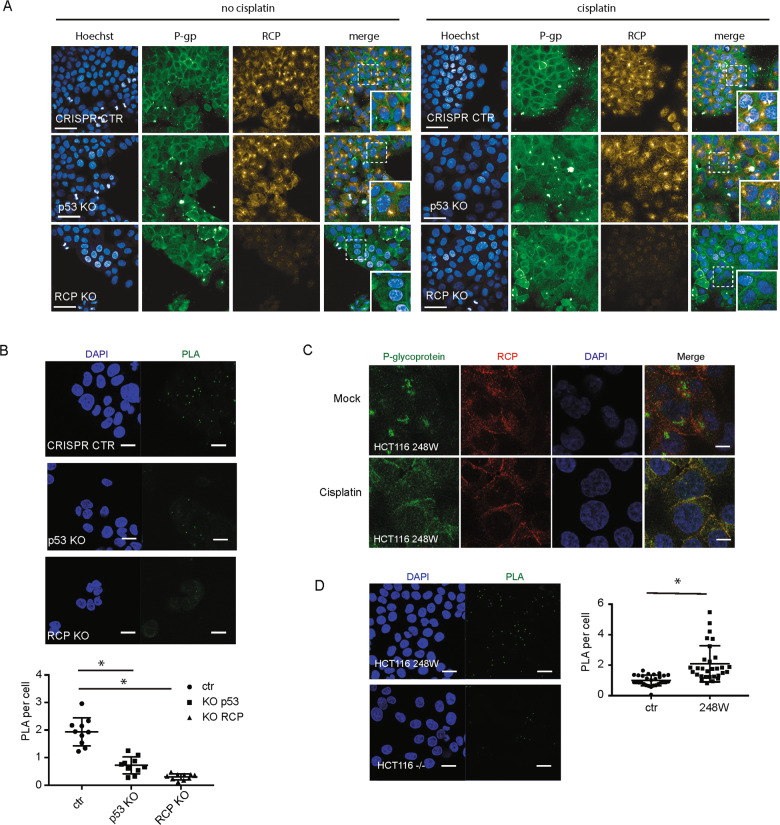
Fig. 4. Mutant p53 promotes RCP and P-gp co-localisation.
A A431 ctr1, A431 RCP KO and A431 p53 KO cells were grown on coverslips and treated with cisplatin 6.7 µM for 2 h. Localisation of endogenous P-gp and RCP was determined with confocal microscopy using antibodies specific for P-gp (Invitrogen Ab, green) and RCP (red). Scale bars are 20 µm. B Proximity ligation assays (PLA) in A431 CRISPR control, RCP KO and p53 KO. Images were taken by confocal microscopy (top). Scale bars are 20 µm. The PLA signal was quantified as dots/nucleus for all the cells and plotted in a box and whiskers plot (bottom). Statistical differences were measured using a one-way ANOVA, multiple testing corrected P < 0.00001 for both, two-sided. Error bars indicate SD of average values of three independent experiments (three repeats per experiment). C HCT116 248W cells were grown on coverslips and treated with cisplatin 6.7 µM for 2 h. Localisation of endogenous P-gp and RCP was determined with confocal microscopy using antibodies specific for P-gp (Santa Cruz Ab, green) and RCP (red). D Images (left) and quantification (right) of PLA in HCT116 null and 248W cells with the antibodies specific against P-gp and RCP. Statistical differences were measured using a t-test, P < 0.00001, two-sided. Error bars indicate SD of average values of three independent experiments (three repeats per experiment).

