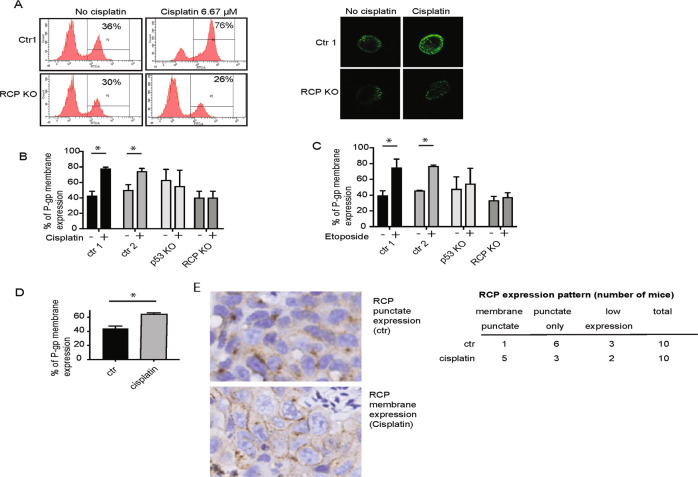
Fig. 5. Plasma membrane expression of P-gp is enhanced in mutant p53 cells upon cisplatin treatment.
A P-gp plasma membrane expression was evaluated by flow cytometry of the A431 control and RCP KO cells treated with cisplatin (6.7 µM for 2 h) (left). Fluorescent images of individual cells are shown on the right, taken after flow cytometry. B Quantification of P-gp plasma membrane expression in A431 ctr1, ctr2, RCP KO and p53 KO cells upon cisplatin treatment (6.7 µM for 2 h). Statistical differences were measured using a one-way ANOVA, multiple testing ctr1 ± cisplatin P = 0.0001, ctr2 ± cisplatin P = 0.0108, two-sided. Error bars indicate SD of average values of three independent experiments. C Quantification of P-gp plasma membrane expression in A431 ctr1, ctr2, RCP KO and p53 KO cells upon etoposide treatment (3.4 µM for 2 h). Statistical differences were measured using a one-way ANOVA, multiple testing ctr1 ± etoposide P < 0.0001, ctr2 ± etoposide P = 0.0002. Error bars indicate SD of average values of three independent experiments. D P-gp plasma membrane expression in HCT116 p53 248W/- in the presence and absence of cisplatin (6.7 µM for 2 h). Statistical differences were measured using a t-test, two-sided P = 0.0011. Error bars indicate SD of average values of three independent experiments. E RCP staining in A431 control xenografts from mice exposed to cisplatin or a vehicle control. Numbers of mice that displayed a membrane staining (including punctate staining), punctate staining only, or low RCP expression are indicated on the right.

