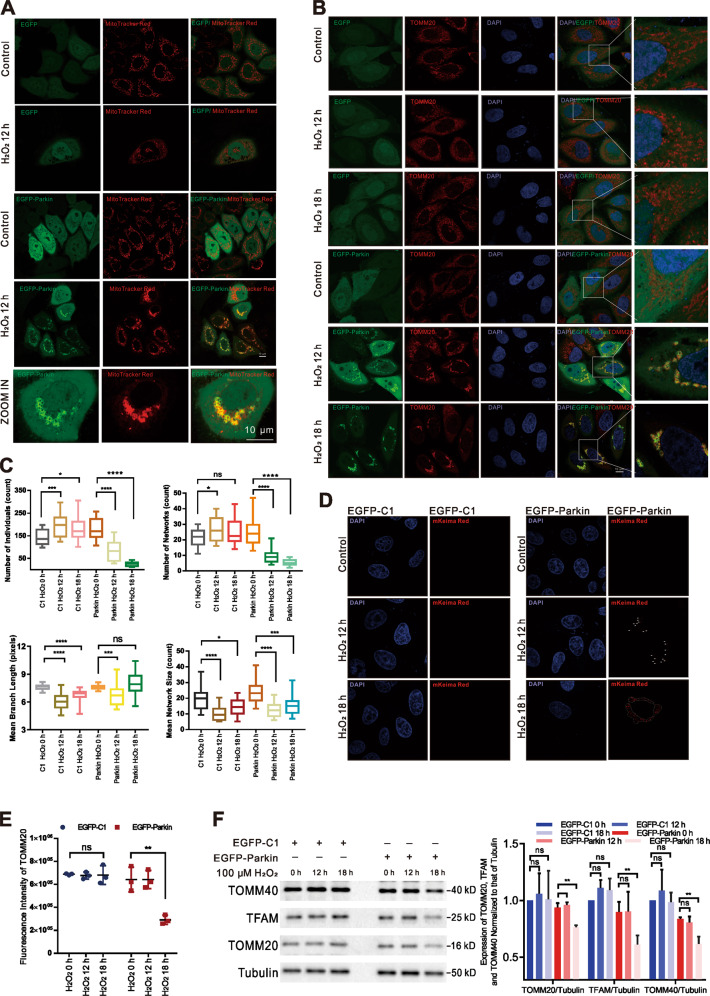
Fig. 1. Mild and sustained stimulation with H2O2 modulates mitochondrial morphology and induces Parkin-mediated mitophagy.
A EGFP-C1 (as a control) or EGFP-Parkin were transfected into cells before 0 h and 12 h of H2O2 treatment. Mitochondria were stained with MitoTracker Red (red). Scale bars, 10 μm. B Cells transfected with EGFP-C1 or EGFP-Parkin were incubated with 100 μΜ H2O2 for 0 h, 12 h, or 18 h. The cells were immunostained with an anti-TOMM20 antibody (red). Scale bars, 10 μm. C Mitochondrial morphology was quantitatively analyzed using the MiNA ImageJ macro tool based on fluorescent images of TOMM20 (~20 cells for each analysis). Unpaired t-test; ns, not significant; *P < 0.05; ***P < 0.001; ****P < 0.0001. The data are presented as the mean ± SD. D HeLa cells were transfected with the mKeima-Red-Mito-7 plasmid along with EGFP-Parkin or EGFP-C1 (as a control) and then treated with 100 μΜ H2O2 for 0 h, 12 h, or 18 h. The white arrows and dashed box show the red fluorescent dots of Keima excited at 560 nm. Scale bar, 10 μm. E The fluorescence intensity of TOMM20 was analyzed by ImageJ in three independent experiments, and the results were subjected to statistical analysis. Ns, not significant; **P < 0.01. F Cells were transfected with EGFP-C1 or EGFP-Parkin plasmids and treated with 100 μΜ H2O2 for 0 h, 12 h, or 18 h. The levels of the mitochondrial markers TFAM, TOMM40, and TOMM20 were evaluated by WB analysis. N = 3; ns, not significant; **P < 0.01. The quantified results are presented as the mean ± SD.

