
Fig. 3. Pairwise comparison across ten different reference panels.
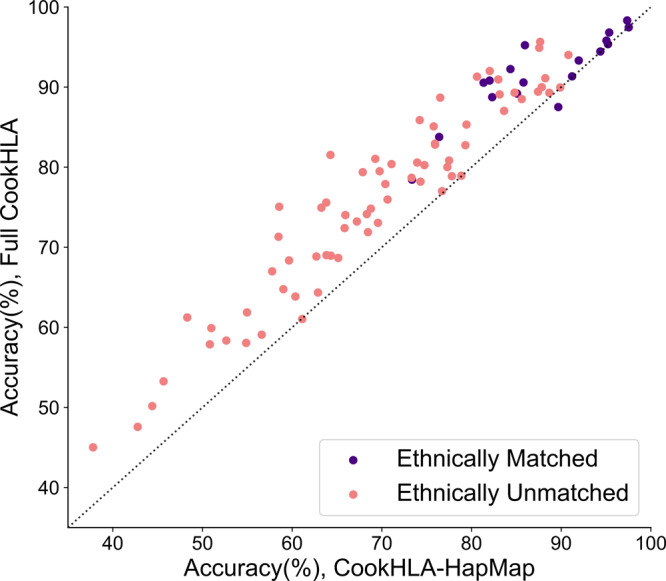
We collected ten reference panels of differing ethnicities and sizes. We then tested every possible pair by assigning one panel as a reference and another as a target, which comprised 88 tests after excluding overlapping sample pairs. We compared the full version of CookHLA to CookHLA-HapMap (upgraded engine, with HapMap genetic map). The dotted line indicates where the two methods’ imputation accuracies are equal.