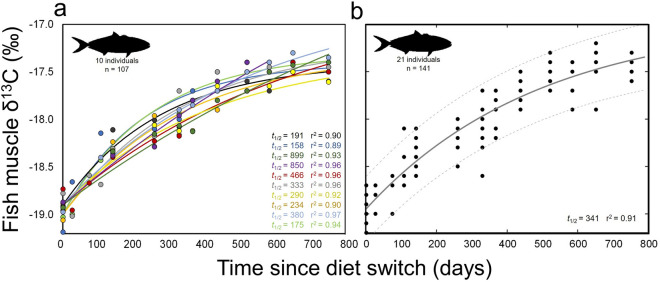
Figure 3.
Change of δ13C with time after diet switch in muscle of (a) individual and (b) grouped captive California yellowtail Seriola dorsalis. (a) Points represent individual δ13C measurements and lines show associated model fits, colored by individual. Values t1/2 is the half-life of 13C for each individual and r2 values are shown for model fit to each individual. Data shown only for yellowtail that were in captive conditions for enough time to reach steady-state with new diet. (b) Model fit (solid line) and 95% confidence bounds (dashed lines) for all yellowtail sampled. Grouped data includes fish that were removed from captivity or suffered mortality during the experimental period.

