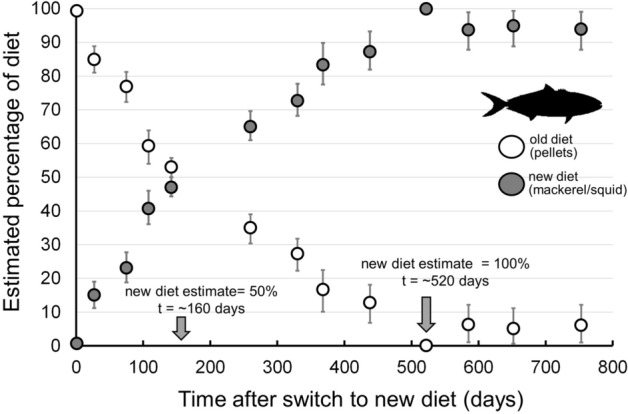
Figure 7.

Bayesian mixing model diet estimates over time in captive California yellowtail Seriola dorsalis, showing time (days) required for mixing models to accurately reflect diet switch in yellowtail muscle. Points represent median diet proportion estimates and error bars show 95% credible intervals. Arrows show the approximate time for yellowtail muscle to represent 50% new diet and 100% new diet. Note that ~ 520 days were required for mixing model estimates to correctly show 100% of new diet, representing ~ 3 half-lives for 15N (181 d) and ~ 1.5 half-lives for 13C (341 d), as calculated from turnover rates in this experiment.
