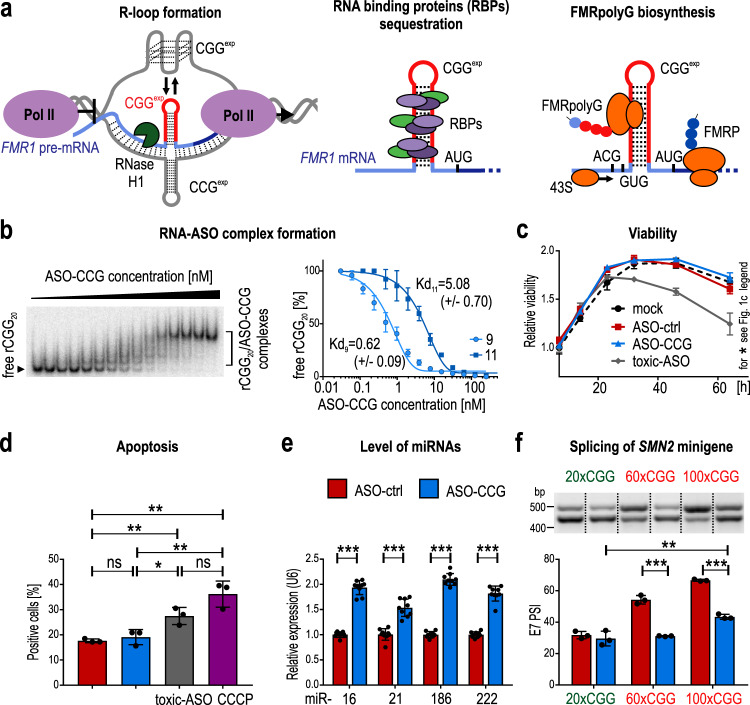
Fig. 1. Binding of ASO–CCG to CGGexp in vitro and in cells reduces the effects of toxic RNA.
a Potential molecular pathomechanisms of FXTAS. b EMSA of the interaction of rCGG20 with ASO–CCGs having 9 and 11 LNA residues. The graph presents means with SDs. N = 3 independent samples for each concentration. Kd, a dissociation constant [nM]. Light blue/dots, 9 nt; dark blue/squares, 11 nt ASO. c Influence of ASOs (9 nt, 200 nM) on COS7 cells viability. Graph presents mean of N = 4 biologically independent samples with the SDs. Black/dots, mock (transfection agent); red/squares, ASO-ctrl; blue/tringles, ASO–CCG; dark gray/diamonds, toxic ASO. For 64-h time point: mock vs ASO-ctrl, P = 0.069; mock vs ASO–CCG, P = 0.187; mock vs toxic ASO, P = 0.0004; ASO-ctrl vs ASO–CCG, P = 0.012; ASO-ctrl vs toxic ASO, P = 0.001; ASO–CCG vs toxic ASO, P = 0.0002. d Influence of ASOs (9 nt, 200 nM) on apoptosis of COS7 cells. Graph presents mean of N = 3 biologically independent samples with the SDs. Dark gray bar, toxic ASO; purple bar, carbonyl cyanide 3-chlorophenylhydrazone (CCCP, positive control). e RT-qPCR quantification of the level of endogenous miRNAs in COS7 cells overexpressing rCGGexp and treated with ASOs (9 nt, 200 nM). Graph presents mean of N = 3 biologically independent samples (each with n = 3 technical replicates) with the SDs. f RT-PCR analysis of SAM68-dependent alternative splicing of exon 7 in SMN2 minigene in COS7 cells overexpressing normal (green) or expanded CGG repeats (red) and treated with ASOs (11 nt, 200 nM). Graph presents mean of N = 3 biologically independent samples with the SDs. 100×CGG ASO-ctrl vs 100×CGG ASO–CCG, P = 0.00002. The upper bands, the exon 7 inclusion isoforms; the lower bands, the exon 7 exclusion isoforms. PSI, the percent of spliced in. b, f Samples were derived from the same experiment and processed in parallel on different gels. Presented gels were cropped. d–f Red bars, ASO-ctrl; blue bars, ASO–CCG. c–f Two-sided, unpaired Student’s t test; *P < 0.05; **P < 0.01; ***P < 0.001; ns, non-significant. b–f Source data are provided as a Source Data file.

