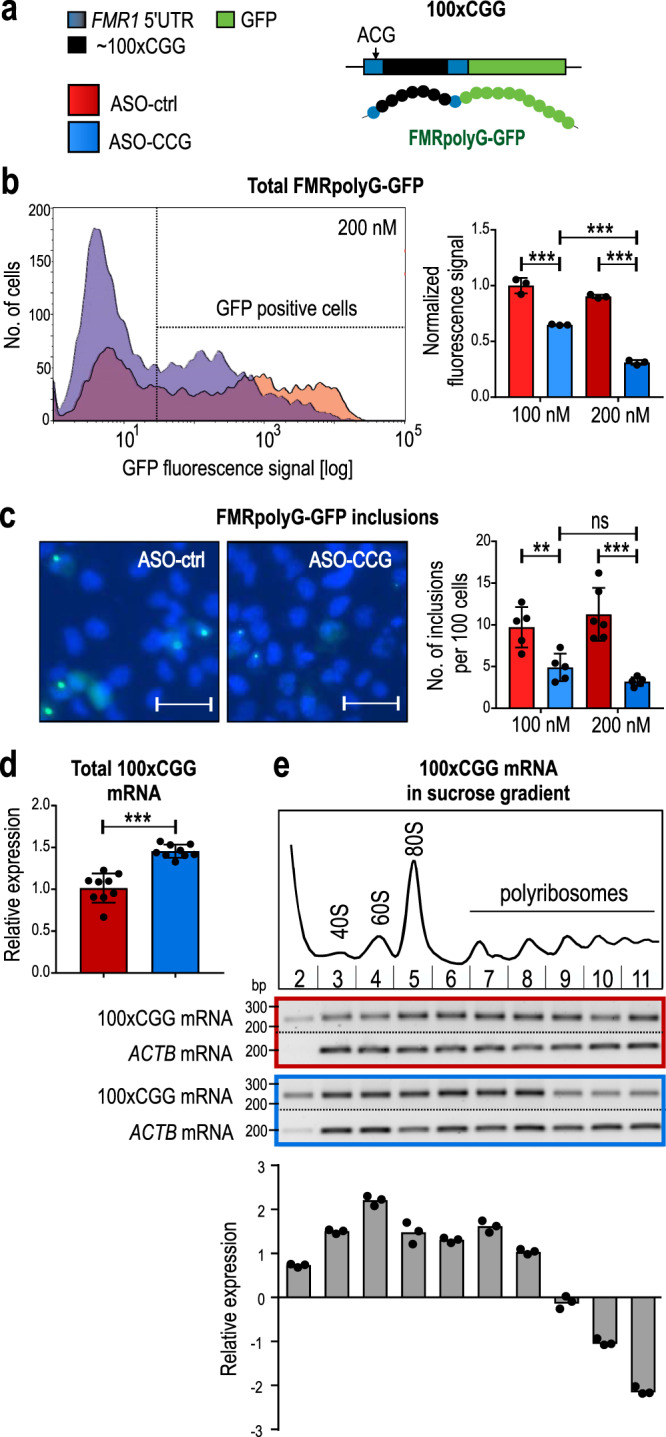
Fig. 2. The effect of ASO–CCG on FMRpolyG biosynthesis and aggregation.

a Schematic of the 100×CGG genetic construct. This construct contains the 5′UTR of the FMR1 gene (blue bars) with ~100 CGG repeats (black bar) fused with the GFP coding sequence (green bar). Biosynthesis of the FMRpolyG-GFP via RAN translation starts from the near-cognate start codon, ACG. b Cytometric quantification of the total level of FMRpolyG-GFP in COS7 cells expressing 100xCGG construct and treated with ASOs (11 nt). The fluorescence signal of GFP-positive cells was measured, excluding dead cells stained with propidium iodide. The histogram presents different FMRpolyG-GFP signal distribution in cells treated with ASO-ctrl (red) or ASO–CCG (blue). N = 3 biologically independent samples. ASO-ctrl 200 nM vs ASO–CCG 200 nM, P = 0.000003. c Microscopic quantification of FMRpolyG-GFP inclusions in COS7 cells expressing 100×CGG construct and treated with ASOs (11 nt). Representative images were pseudo-colored and merged; green, GFP-positive inclusions; blue, nuclei stained with Hoechst 33342; scale bars, 50 µm. N = 6 biologically independent samples for ASO-ctrl 200 nM and N = 5 for other conditions. ASO-ctrl 200 nM vs ASO–CCG 200 nM, P = 0.0003. d RT-qPCR quantification of total mRNA from 100xCGG construct in COS7 cells treated with ASOs (9 nt, 200 nM). N = 3 biologically independent samples (each with n = 3 technical replicates). e Association of 100xCGG mRNA with polyribosomes. Extracts from COS7 cells transfected with the 100×CGG construct and 200 nM ASOs (9 nt) were fractionated on a linear sucrose gradient (15–45%). The total RNA was isolated from the collected fractions representing free mRNAs (the first fraction), monoribosomes, and polyribosomes. Cropped gel presents RT-PCR results. The graph presents RT-qPCR results with a mean of n = 3 technical replicates with the SDs. The reference sample is the corresponding fraction in ASO-ctrl-treated cells and the reference gene is GAPDH. The experiment was repeated 2 times with similar results. b–d Red bars, ASO-ctrl; blue bars, ASO–CCG; light colors, 100 nM; dark colors, 200 nM. Graphs present means of indicated N with the SDs. Two-sided, unpaired Student’s t test; *P < 0.05; **P < 0.01; ***P < 0.001; ns, non-significant. b–e Source data are provided as a Source Data file.
