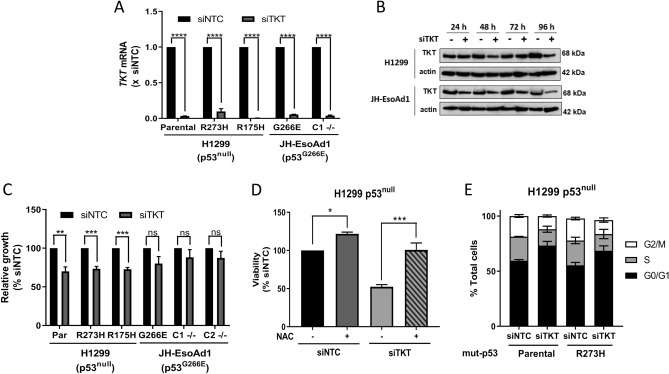
Figure 2.
Transient knockdown of TKT slows cell growth and induces cell cycle arrest in H1299 cells irrespective of p53 status. (A) TKT mRNA expression in H1299 parental (p53null), p53R273H and p53R175H cells and JH-EsoAd1 parental (p53G266E) and p53−/− clone 1 (C1 −/−) following 24 h TKT knockdown with siRNA, normalised to siNTC (siNTC, non-targeting control; siTKT, TKT siRNA). (B) Western blots for TKT in H1299 and JH-EsoAd1 parental cells following TKT knockdown with siRNA for 24, 48, 72 and 96 h, showing actin as a loading control (C) Relative growth of H1299 parental (Par, p53null), p53R273H and p53R175H cells and JH-EsoAd1 parental (p53G266E), p53−/− clones 1 (C1 −/−) and 2 (C2 −/−) following 96 h TKT knockdown with siRNA. (D) H1299 parental (p53null) cells + /- N-acetyl-cysteine (NAC, 5 mM) −/−) following 96 h TKT knockdown with siRNA. (C,D) Data are expressed as a percentage of siNTC. (E) Changes in cell cycle distribution in H1299 parental (p53null) and p53R273H cells following 96 h TKT knockdown with siRNA. Data represent mean, error bars = SEM, n = 3 for all studies excluding (B,E) where blots and cell cycle analysis are representative of 2 independent experiments. (A,C) Unpaired Student’s t-test (D) One-way ANOVA with Dunnett’s multiple comparison post-test. ns, not significant; *p < 0.05; **p < 0.01; ***p < 0.001; ****p < 0.0001.

