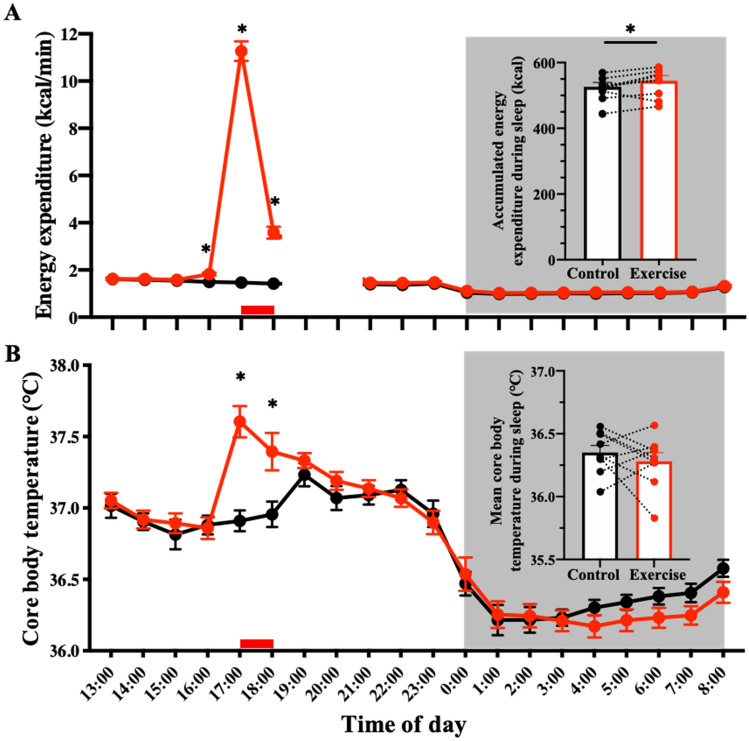
Figure 2.
Time-course of energy expenditure and core body temperature. Time-course of energy expenditure (A) and core body temperature (B) during the entire experiment is shown. Hourly means ± SE are shown for control (filled black circle) and exercise trials (filled red circle), respectively. The red bar at the bottom represents exercise or a sedentary period, and the gray area represents the sleep period. To attach PSG electrodes, participants exited from the metabolic chamber (19:00–21:00). *Represents a statistically significant difference between control and exercise trials by post hoc comparisons using Bonferroni’s correction for multiple comparisons (*p < 0.05).

