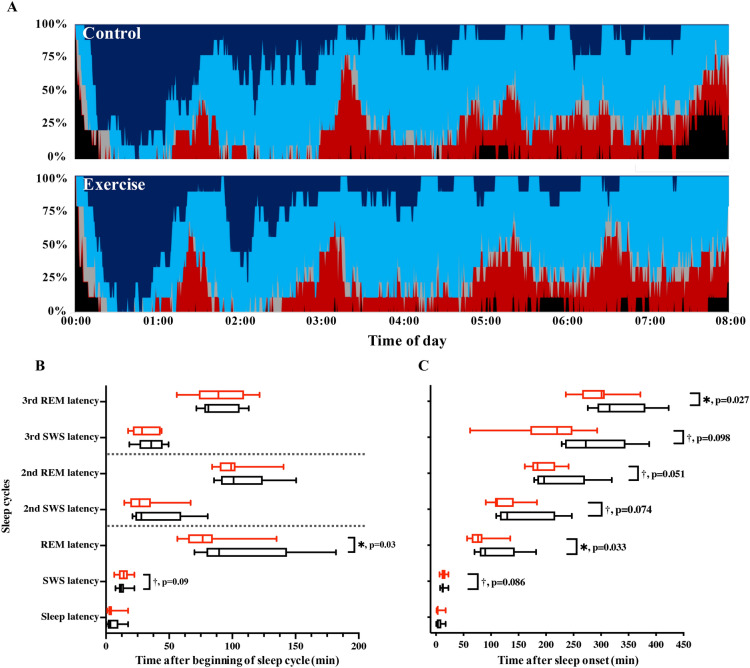
Figure 3.
Time-course of sleep architecture and timing of sleep cycles. (A) Sleep architecture of the 9 participants for the control (upper panel) and exercise trials (bottom panel). Percentage of participants in stage W (wakefulness; black), stage N1 (gray), stage N2 (light blue), SWS (dark blue), and stage REM (red) changed with the sleep time. B and C: Latencies of SWS and REM sleep evaluated as time after beginning of sleep cycle (B) and as time after sleep onset (C) are shown. Latency of sleep stage transition in each sleep cycle is shown with black and red box-whisker plots for control and exercise trials, respectively. * and † represent statistically significant differences between the control trial and exercise trial by a paired t-test (*p < 0.05; †p < 0.1).

