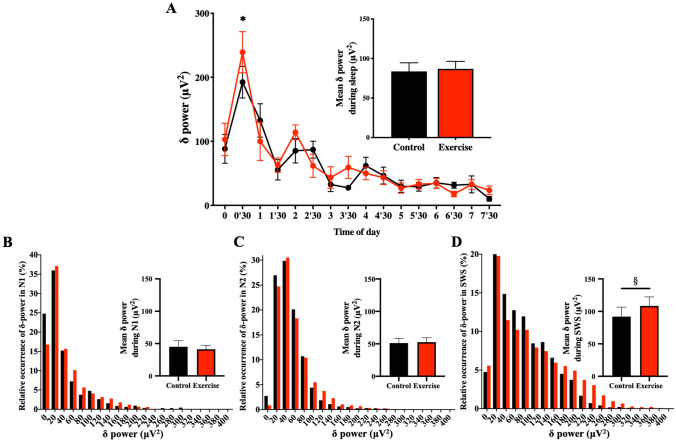
Figure 4.
Time-Course of δ-Power of the non-REM Sleep EEG & Relative Occurrence of δ-Power in Each non-REM stage. (A) The 30-min means ± SE of δ-power of the 9 participants are shown as a line graph and accumulated δ-power during non-REM is shown as a bar graph. *Represents a statistically significant difference between the control trial and exercise trial by post hoc comparisons using Bonferroni’s correction for multiple comparisons (p < 0.05). (B–D) Relative occurrences of δ-power in N1 (B), N2 (C), and SWS (D) stages are shown. Inserted bar graphs in each panel represent mean δ-power in each non-REM stage. Black plots (filled black circle) and bars (filled black square) represent control trials, and red plots (filled red circle) and bars (filled red square) represent exercise trials. §Represents a statistically significant difference between control trial and exercise trial by a paired t-test (§p < 0.05).

