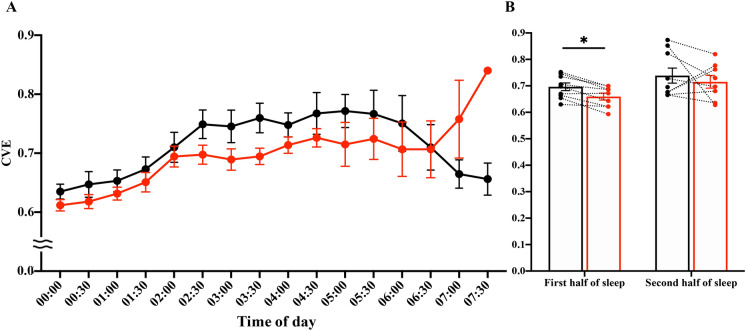
Figure 5.
Envelope analysis. (A) Time-course of the CVE during the entire sleep. The 30-min means ± SE of the CVE are shown for the control trial (filled black circle) and exercise trial (filled red circle). (B) Mean CVE during the first half and second half of sleep are shown. Mean CVE is shown for the control trial (open black square) and exercise trial (open red square). Dotted lines connect the same participants. *Represents a significant difference between the control trial and exercise trial by a paired t-test (*p < 0.05). Note that the CVE values did not differ significantly between control and exercise in the last hour of sleep. CVE values were most likely affected by the very low δ power values during this time.

