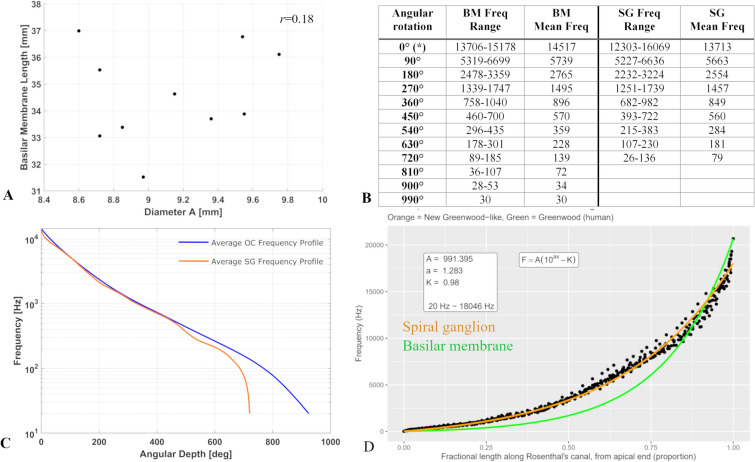
Figure 3.
(A) Basilar membrane length is plotted against diameter A. No correlation was noted between these values (r = 0.18). (B) Table showing mean angular frequencies obtained from ten specimens imaged using synchrotron radiation phase-contrast imaging. (C) Average basilar membrane and spiral ganglion frequencies plotted against cochlear angular depth. This average curve was determined by calculating the mean angular depth of each frequency in all samples. (D) Results of least squares fitting an exponential function to 3D SR-PCI SG tonotopic data. Greenwood’s function for the BM tonotopic distribution is illustrated in green for reference, and the SG function relating proportional length to tonotopic frequency developed herein is illustrated in orange.

