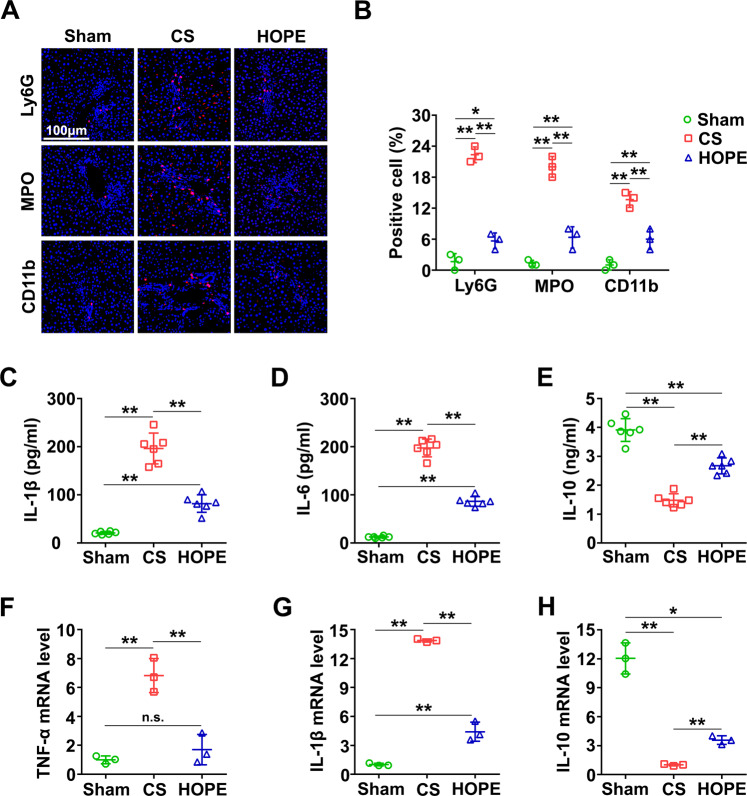
Fig. 2. HOPE reduces DCD liver inflammation in rats.
A IF staining of Ly6G, MPO and CD11b were performed on paraffin-embedded section of rat liver tissues. Scale bar = 100 μm. B IF stained fluorescence of Ly6G, MPO and CD11b were quantified using Image-pro plus 6.0. Data are mean ± SD, *P < 0.05 and **P < 0.01 by two-way ANOVA followed by Tukey’s test. n = 3 per group. C–E Liver tissues expression levels of IL-1β, IL-6, and IL-10 were analyzed with the relative ELISA kits. Data are mean ± SD, **P < 0.01 by one-way ANOVA followed by Tukey’s test. n = 6 per group. F–H mRNA expression level in liver of TNF-α, IL-1β, and IL-10 were tested by real-time PCR. Data are mean ± SD, n.s., not significant; *P < 0.05 and **P < 0.01 by one-way ANOVA followed by Tukey’s test. n = 3 per group.

