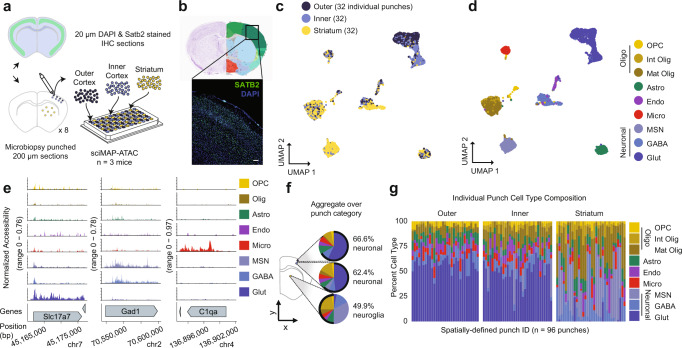
Fig. 2. sciMAP-ATAC reveals spatially distinct cell type composition in the mouse somatosensory cortex.
a Experiment schematic of sciMAP-ATAC in the mouse somatosensory cortex. b DAPI and SATB2 staining of SSp cortex from sciMAP-ATAC histological section (scale bar, 50 µm) in reference to matched rerference atlas image (Allen Mouse Brain Atlas: http://atlas.brain-map.org/atlas?atlas=1&plate=100960312, ref. 25). c UMAP of 7779 cells colored by punch location category. Each category contains cells from 32 spatially distinct tissue punches. d UMAP as in c, colored by cell type (OPC oligodendrocyte precursor cells, Int Olig intermediate oligodendrocytes, Mat Olig mature oligodendrocytes, Astro astrocytes, Endo endothelia, Micro microglia, MSN medium spiny neurons, GABA GABAergic (inhibitory) neurons, Glut glutamatergic (excitatory) neurons). e ATAC-seq profiles for cells aggregated by cell type for marker genes; colored by cell type as in d. f Aggregate cell type composition over punches belonging to the broad region categories; colored by cell type as in d. g Cell type composition for each of the 96 individual punches split by broad region category; colored by cell type as in d. Source data are provided as a Source data file.

