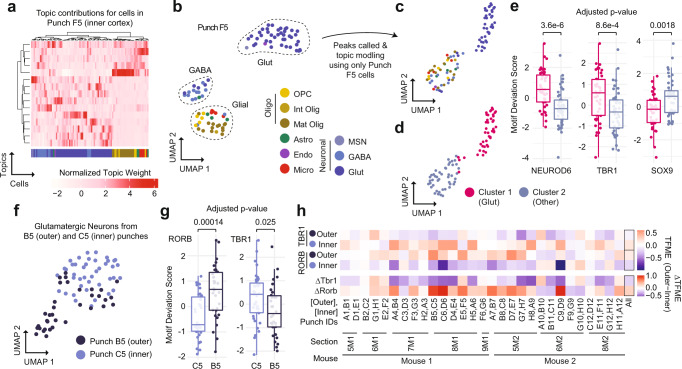
Fig. 3. sciMAP-ATAC enables the analysis and comparison of cells and cell types from individual spatial positions.
a Topic weight matrix for cells present only in a single punch (F5, inner cortex punch), annotated by cell type (bottom); colored by cell type from the full dataset (Fig. 2d). b UMAP of cells from punch F5 showing spatially distinct groupings for cell type; colored by cell type from the full dataset (Fig. 2d). c Isolated analysis of cells from Punch F5 for peak calling, topic modeling, and visualized via UMAP; colored by cell type from the full dataset (Fig. 2d). d Two major clusters identified from the isolated analysis of punch F5 (Glut glutamatergic (excitatory) neurons). e Transcription factor motif enrichments for the isolated analysis of punch F5, indicating that cluster 1 (n = 44 cells) is made up of glutamatergic neurons and cluster 2 (n = 45 cells) is made up of other cell types. Center line represents median, lower, and upper hinges represent first and third quartiles, whiskers extend from hinge to ±1.5 × IQR, individual cells represented as colored dots. f UMAP of all glutamatergic neuron cells from two adjacent punches (C5, inner cortex, and B5, outer cortex) after topic modeling on the isolated cell profiles. g Transcription factor motif enrichments for glutamatergic cells from adjacent punches from inner cortex (n = 39 cells) and outer cortex (n = 30 cells) shown in f; colored by individual punch as in f. Two-sided Mann–Whitney U test with Bonferroni–Holm correction. Center line represents median, lower and upper hinges represent first and third quartiles, whiskers extend from hinge to ±1.5 × IQR, individual cells represented as colored dots. h Motif enrichments across glutamatergic neurons across all punch pairs. TFME transcription factor motif enrichment. Source data are provided as a Source data file.

