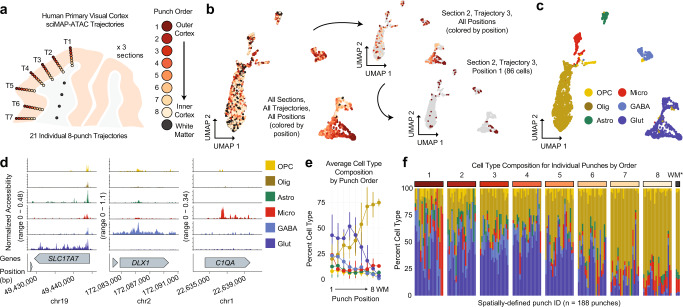
Fig. 4. sciMAP-ATAC trajectories through the human primary visual cortex.
a sciMAP-ATAC punching schematic showing one of three adjacent sections from one individual. A total of 21 eight-punch trajectories (T) spanning the cortex were produced. b UMAP of cells colored by position within their respective trajectory as in a. Top right shows the same UMAP with all cells grayed out with the exception of cells from the third trajectory from section 2. Bottom right shows all cells grayed out with the exception of cells from a single punch; the outermost cortical position (1) from the third trajectory of the second section. c UMAP as in b colored by cell type (OPC oligodendrocyte precursor cells, Olig oligodendrocytes, Astro astrocytes, Micro microglia, GABA GABAergic (inhibitory) neurons, Glut glutamatergic (excitatory) neurons). d ATAC-seq profiles for cells aggregated by cell type for marker genes; colored by cell type as in c. e Aggregate cell type composition across the 21 trajectories (n = 4547 cells over 188 independent punches); colored by cell type as in d. Data are presented as mean values ± SD. f Cell type composition for each of the 188 individual punches split by trajectory position. Punches from the WM indicated by an asterisk are aggregated by section. Colored by cell type as in d. Source data are provided as a Source data file.

