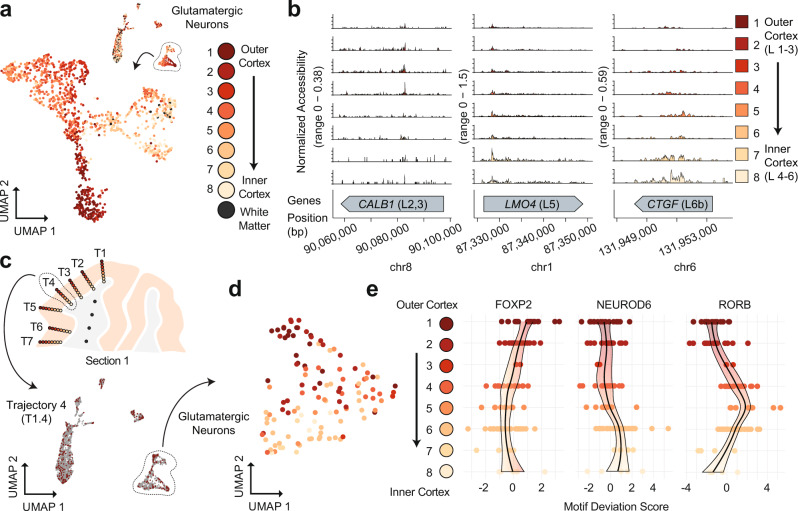
Fig. 6. sciMAP-ATAC shows spatial epigenetic patterns of glutamatergic neurons.
a Isolation and UMAP visualization of human VISp glutamatergic neurons from all cells (top right), colored by punch position. An interactive, three-dimensional UMAP embedding is available as Supplementary Data 4. b ATAC-seq profiles for glutamatergic neurons along trajectory positions for layer (L)-specific marker genes CALB1 (layers 2 and 3), LMO4 (layer 5), and CTGF (layer 6b); colored by punch position as in a. c Cells from section 1, Trajectory 4 (T1.4, top) are shown in color on the UMAP of all cells, with other cells shown in gray (bottom); colored by position as in a. d UMAP of glutamatergic neurons from Trajectory 1.4 after topic modeling on the isolated cells; colored by position along the trajectory as in a. e DNA-binding motif enrichment for layer-specific factors for Trajectory 1.4 shown in d, with cells split by their positions along the trajectory. Source data are provided as a Source data file.

