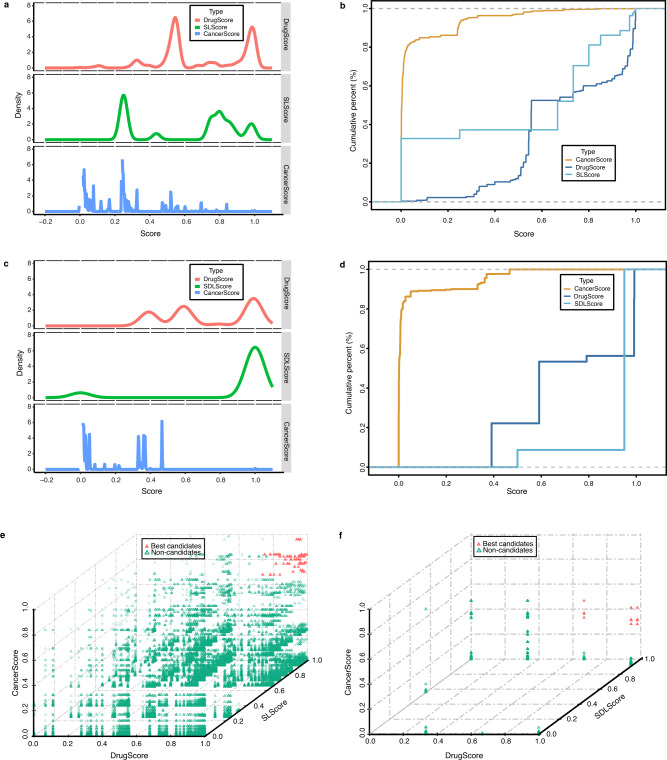
Fig. 3. Distribution of three scores and top candidates.
a Probability distribution curve of the three scores in SL. Lines indicate DrugScore (red), SLScore (green), and CancerScore (blue). b Cumulative distribution curve of the three scores in SL. Lines indicate CancerScore (yellow), DrugScore (dark blue), and SLScore (sky blue). c Probability distribution curve of the three scores in SDL, same as SL. d Cumulative distribution curve of the three scores in SDL, same as SL. Three-dimensional graph of drug repositioning results for best repurposable drug candidates (red solid triangle) and non-candidates (green hollow triangle) based on SL (e) or SDL (f).

