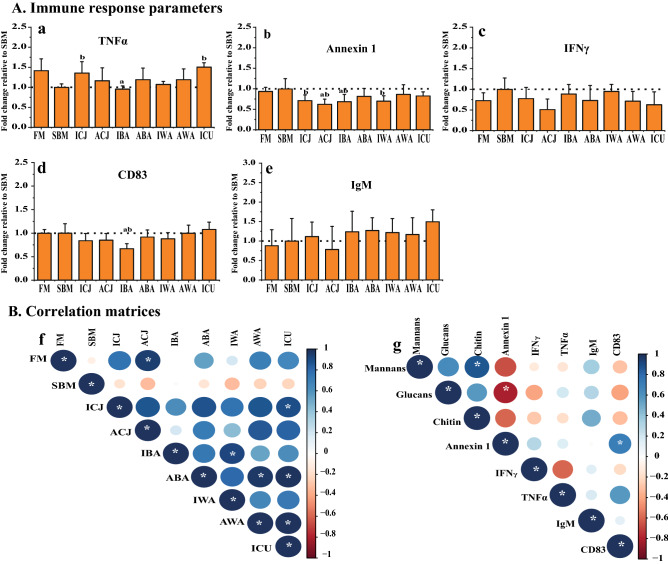
Figure 2.
Immune responses (A) of Atlantic salmon fry fed soybean meal-based diets with yeasts. Protein expression values for distal intestine (a–e) were obtained by indirect ELISA and are expressed as fold-change relative to the value obtained for the SBM group. Correlation matrices between the immune markers, and calculated mannan, glucan and chitin intake are shown in panel (B). Graph (f) shows the correlation between all the experimental diets using five immunological markers (TNFα, Annexin 1, IFNγ, CD83 and IgM). Graph (g) shows the correlation between the calculated average daily intake of glucan, mannan and chitin, and the previously mentioned immune markers. The average daily intake of glucans, mannans and chitin were calculated from average dry matter daily feed intake and the composition of the respective cell wall components in each yeast (Table 1). For the correlation matrices, positive correlations are displayed in blue and negative correlations in red color; both the color intensity and the size of the circle are proportional to the correlation coefficients. The diets are: FM-fishmeal-based; SBM-Soybean meal-based; 7 other diets containing 40% SBM and 5% of inactivated Cyberlindnera jadinii (ICJ), autolyzed C. jadinii (ACJ), inactivated Blastobotrys adeninivorans (IBA), autolyzed B. adeninivorans (ABA), inactivated Wickerhamomyces anomalus (IWA), autolyzed W. anomalus (AWA) and ref-C. jadinii (ICU). The letters a and b directly above the bar charts (a–e) denote treatment(s) with a statistical difference (P < 0.05) compared to the fishmeal and soybean meal control groups, respectively. Correlations (f, g) with significant values at P < 0.05 are shown with *.

