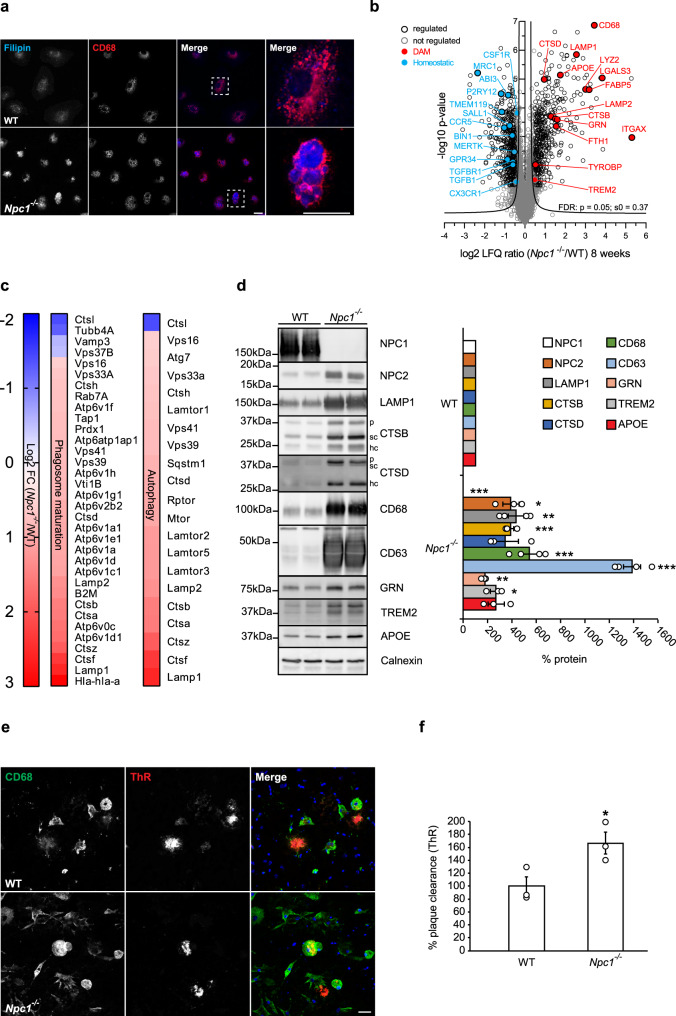
Fig. 1. Loss of NPC1 induces microglial molecular and functional changes in symptomatic Npc1−/− mice.
a Immunocytochemistry of cultured primary microglia. Microglia were analyzed from three independent experiments (n = 3). Cholesterol was visualized using Filipin (blue). Npc1−/− cells show increased Filipin levels compared to WT, demonstrating cholesterol accumulation. Boxed regions are enlarged in right panels and show cholesterol accumulation within CD68 positive compartments (red) of Npc1−/− microglia. Scale bars: 25 μm. b Proteome analysis of acutely isolated microglia from 8-weeks old WT and Npc1−/− littermates reveals significantly decreased homeostatic and increased DAM markers in Npc1−/− microglia. The negative log10 transformed p-value of each protein is plotted against its average log2 transformed LFQ ratio between Npc1−/− and WT microglia. The hyperbolic curves indicate the threshold for a permutation-based FDR correction for multiple hypotheses. Significantly changed proteins (p-value less than 0.05 and FDR corrected) with a log2 fold change larger than 0.5, or smaller than −0.5 are encircled in black (regulated), not regulated proteins are encircled in gray and selected homeostatic (downregulated) and DAM (upregulated) proteins are highlighted in blue and in red, respectively. Microglia were analyzed from three independent experiments (n = 3). c Phagosome maturation and autophagy are the most affected pathways upon NPC1 loss of function. The heatmap shows the average log2 transformed LFQ ratio between WT and Npc1−/− microglia from significantly regulated proteins involved in phagosome maturation and autophagy according to IPA. d Validation of MS data via western blot analysis and corresponding quantification. Representative immunoblots of acutely isolated WT and Npc1−/− microglia show increased levels of DAM proteins (NPC2, LAMP1, CTSB, CTSD, CD68, CD63, GRN, TREM2, and APOE). Calnexin was used as loading control. For cathepsins: p = pro-form; sc = single chain form; hc = heavy chain form. Proteins were quantified by densitometry (ImageJ—NIH). At least three independent experiments were performed. Values were normalized on WT control and represent mean ± SEM (unpaired two-tailed Student’s t-test). NPC1 (n = 4, p = 5.5 × 10⁻⁸); NPC2 (n = 3, p = 0.011); LAMP1 (n = 4, p = 0.0019); CTSB (n = 3, p = 5 × 10⁻⁴); CTSD (n = 3, p = 0.08); CD68 (n = 4, p = 6 × 10⁻⁴); CD63 (n = 4, p = 1.5 × 10⁻⁶); GRN (n = 3, p = 0.003); TREM2 (n = 3, p = 0.015); APOE (n = 3, p = 0.068). e Representative images of WT and Npc1−/− microglia plated onto APPPS1 cryosection. Microglial lysosomes were visualized with an antibody against CD68 (green), while Aβ plaques were detected with Thiazine Red (ThR) that stains fibrillar Aβ (red). Hoechst was used for nuclear staining (blue). Scale bar: 25 μm. f Quantification of Aβ plaque clearance was performed by comparing ThR positive area between a brain section incubated with microglia and the consecutive brain section where no cells were added. Values are expressed as percentages of amyloid plaque clearance normalized to the WT and represent mean ± SEM from three independent experiments (n = 3, p = 0.039, unpaired two-tailed Student’s t-test).

