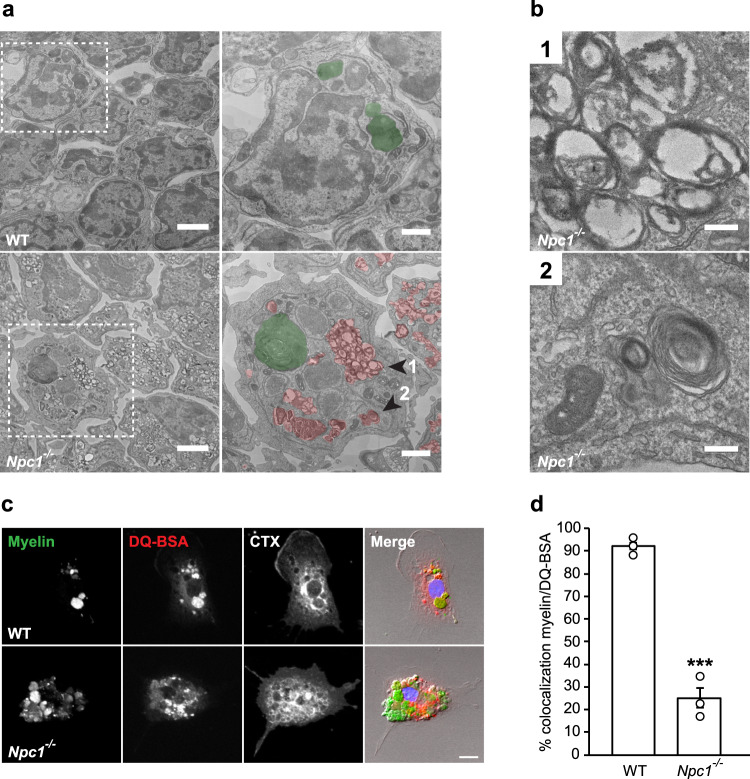
Fig. 6. Myelin accumulation in late endosomes/MVBs of Npc1−/− microglia.
a EM analysis of microglia acutely isolated from pre-symptomatic WT and Npc1−/− mice from three independent experiments (n = 3) shows the significant intracytoplasmic accumulation of MVBs in Npc1−/− cells. Boxed regions are depicted at higher magnification in right panels (MVBs and lysosomes are pseudocolored in red and green, respectively). Scale bars: 2 μm (left panels) and 1 μm (right panels). b Representative high magnification images of Npc1−/− cell shown in (a) (arrowheads 1 and 2) revealing accumulation of MVBs (1). Undigested lipid material (lamellar structures) could be detected within MVBs (2). Scale bars: 0.2 μm. c Transport of phagocytosed myelin (green) was followed over 1 h in P7 WT and Npc1−/− microglia from three independent experiments (n = 3) using DQ-BSA to visualize lysosomal compartments (red) and fluorescently labeled cholera toxin (CTX, white) to visualize endocytic vesicles. Scale bar: 10 μm. d Quantification of the in vitro myelin transport assay shows that, in contrast to WT control, phagocytosed myelin did not reach lysosomal compartments in Npc1−/− microglia. Values are expressed as percentages of myelin signal colocalizing with DQ-BSA positive lysosomes and represent mean ± SEM from three independent experiments (n = 3, p = 0.0003, unpaired two-tailed Student’s t-test).

