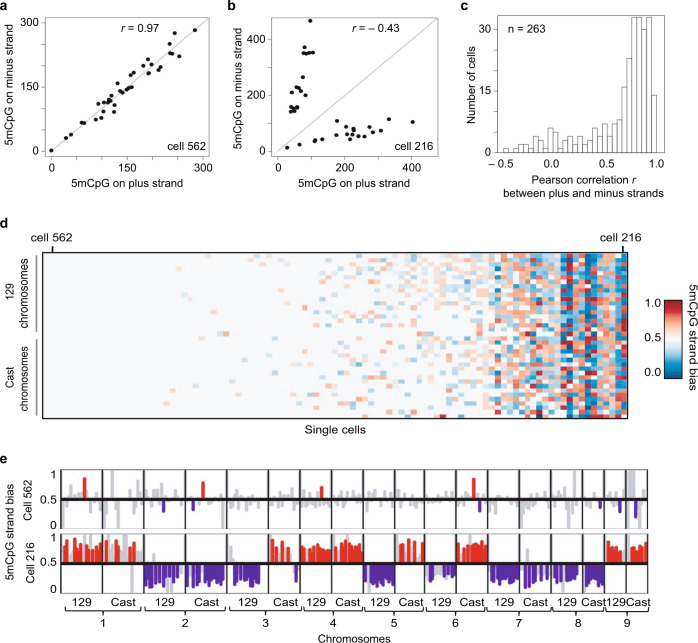
Fig. 2. Cell-to-cell heterogeneity in genome-wide strand-specific methylome landscapes in mES cells.
a An example of a mES cell (cell #562) processed by scMspJI-seq shows similar amounts of 5mCpG on both the plus and minus strand of each chromosome. b Another mES cell (cell #216) with asymmetric amounts of 5mCpG between the plus and minus strands of each chromosome. c Histogram of Pearson correlations between the 5mCpG levels on the plus and minus stands over all chromosomes in a cell show that while a majority of cells have similar amounts of 5mCpG on both strands (high Pearson correlation), a small fraction of cells display unequal levels of 5mCpG between the two strands of each chromosome (low Pearson correlation). d Ordered heatmap showing 5mCpG strand bias per chromosome for the maternal and paternal alleles in individual mES cells. e 5mCpG strand bias of cell #526 (top) and cell #216 (bottom) for 10 Mb bins along the first 9 chromosomes are shown with statistically significant (P < 0.05, likelihood ratio test) strand biases towards the plus and minus strands shown in red and blue, respectively. Strand biases of bins that are not statistically significant are shown in gray (P > 0.05, likelihood ratio test).

