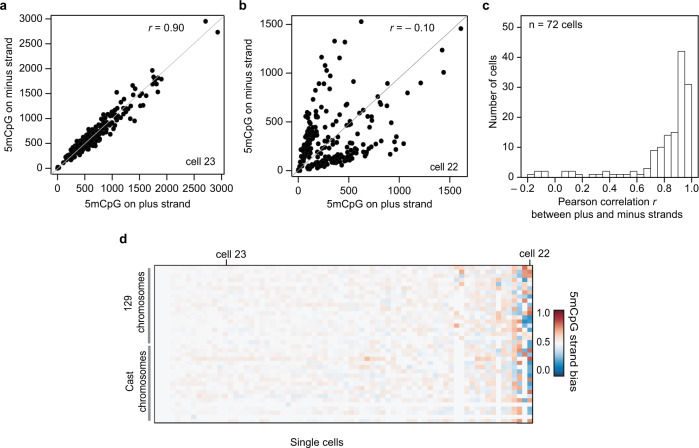
Fig. 3. Variability in strand-specific 5mCpG profiles in mES cells.
a A representative mES cell (cell #23) with similar amounts of 5mCpG within 10 Mb bins on both DNA strands. b Another representative mES cell (cell #22) with unequal amounts of 5mCpG between the two DNA strands for 10 Mb bins. c Histogram of Pearson correlations between the 5mCpG levels on the plus and minus stands over the entire genome (10 Mb) in a cell. d Ordered heatmap showing 5mCpG strand bias per chromosome for maternal and paternal alleles in individual mES cells (n = 72). The results in this figure are based on strand-specific reanalysis of single-cell bisulfite sequencing data obtained from previous work by Clark et al.25.

