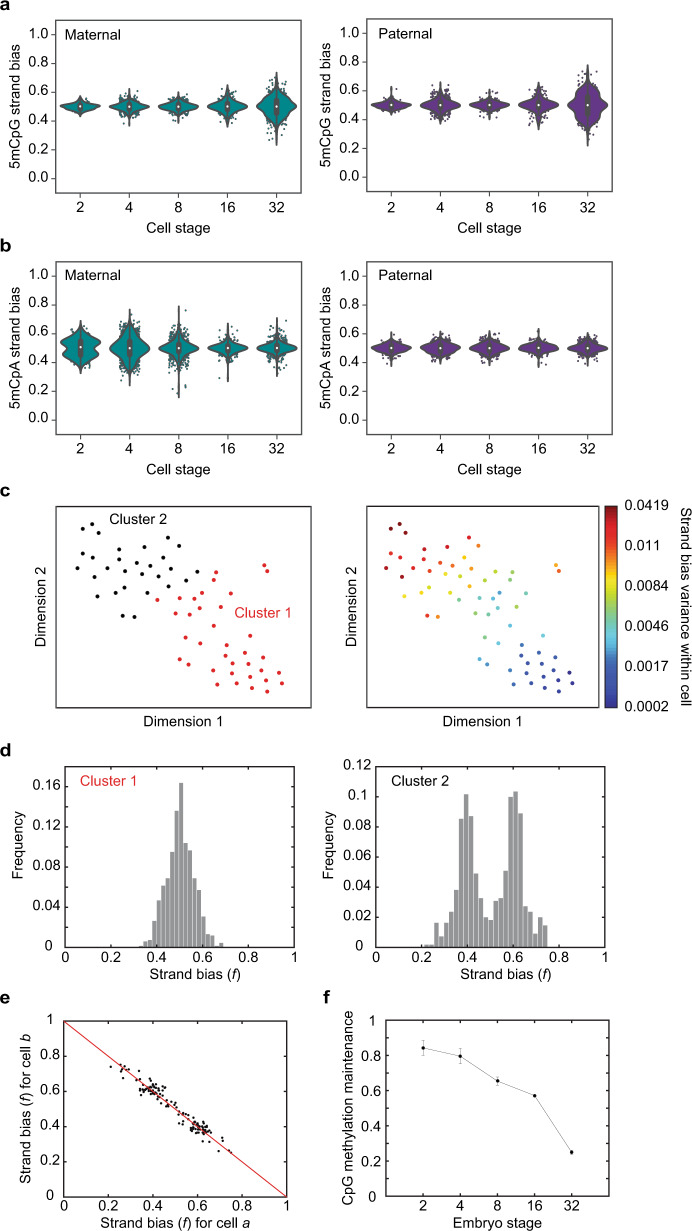
Fig. 4. DNA demethylation dynamics in preimplantation mouse embryos.
a Violin plots of 5mCpG strand bias for both the maternal (left) and paternal (right) genome show a tight distribution centered around f = 0.5 till the 16-cell stage and a wider distribution at the 32-cell stage of development (n = 332 single cells from 42 embryos). b For the maternal genome (left), 5mCpA strand bias shows a bimodal distribution at the 2-cell stage that moves towards a tight unimodal distribution by the 32-cell stage of development. The paternal genome (right) shows a unimodal distribution centered at f = 0.5 throughout preimplantation development till the 32-cell stage (n = 332 single cells from 42 embryos). In panels (a, b), the white dot indicates the median, the black bar indicates the first and third quartile, and the whiskers indicate the minima and maxima. c t-SNE map displaying two clusters of single cells at the 32-cell stage. These clusters were identified by k-means clustering on the 5mCpG strand bias for all paternal chromosomes (left). The right panel shows the strand bias variance within each cell superimposed on the t-SNE map. d The two clusters shown in panel (c) display dramatically different 5mCpG strand-bias distributions—one cluster (left) shows a unimodal distribution while the other cluster (right) shows a bimodal distribution implying loss of methylation maintenance. e Strand bias of chromosomes between anti-correlated cell pairs suggesting that these pairs are sister cells. f Bulk hairpin bisulfite sequencing reveals that the fraction of CpG dyads that are symmetrically methylated drops substantially from the 16- to 32-cell stage of development (n = 2 biologically independent bulk samples). Error bars represent the genome-wide standard deviation from the mean methylation maintenance.

