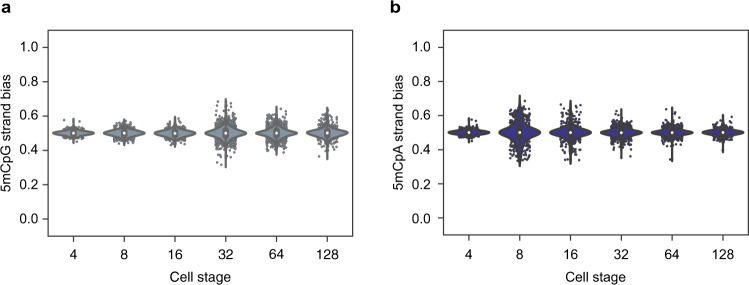
Fig. 5. DNA demethylation dynamics in preimplantation human embryos.
a Violin plots showing 5mCpG strand bias from the 4- to 128-cell stage of human embryogenesis. In the absence of allele-specific information, the strand bias represents an average over both alleles. Similar to mouse embryos, human embryos initially show no 5mCpG strand bias followed by an increase at the 16-cell stage of embryogenesis. b Violin plots showing 5mCpA strand bias from the 4- to 128-cell stage of human embryogenesis. 5mCpA strand bias dynamics in human embryos is similar to that observed in mouse embryos in Fig. 4b. In these panels, the white dot indicates the median, the black bar indicates the first and third quartile, and the whiskers indicate the minima and maxima.

