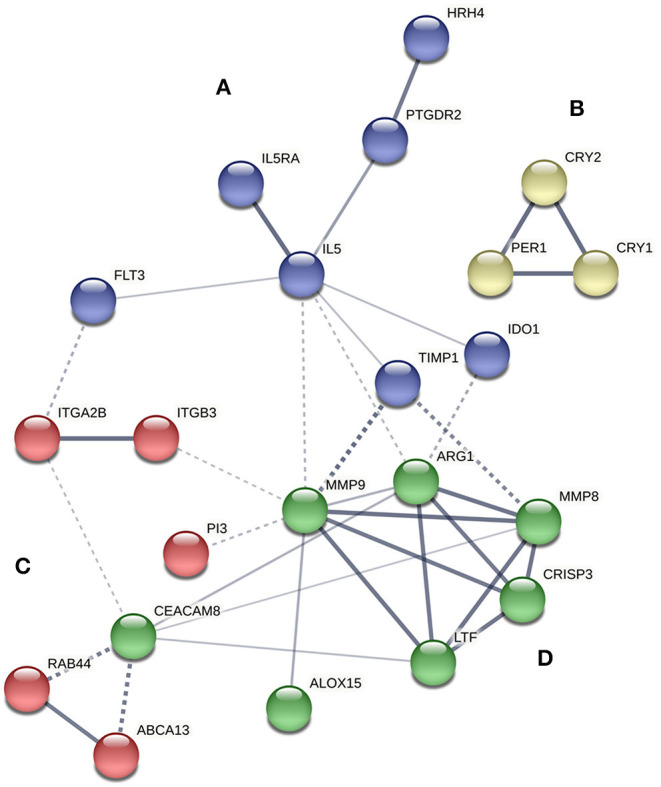
Figure 1.

Protein interaction network of proteins encoded by differentially expressed genes between controls and asthmatic patients using STRING software. The strength of data support is indicated by line thickness. The four main clusters are shown in blue (A), yellow (B), red (C), and green (D).
