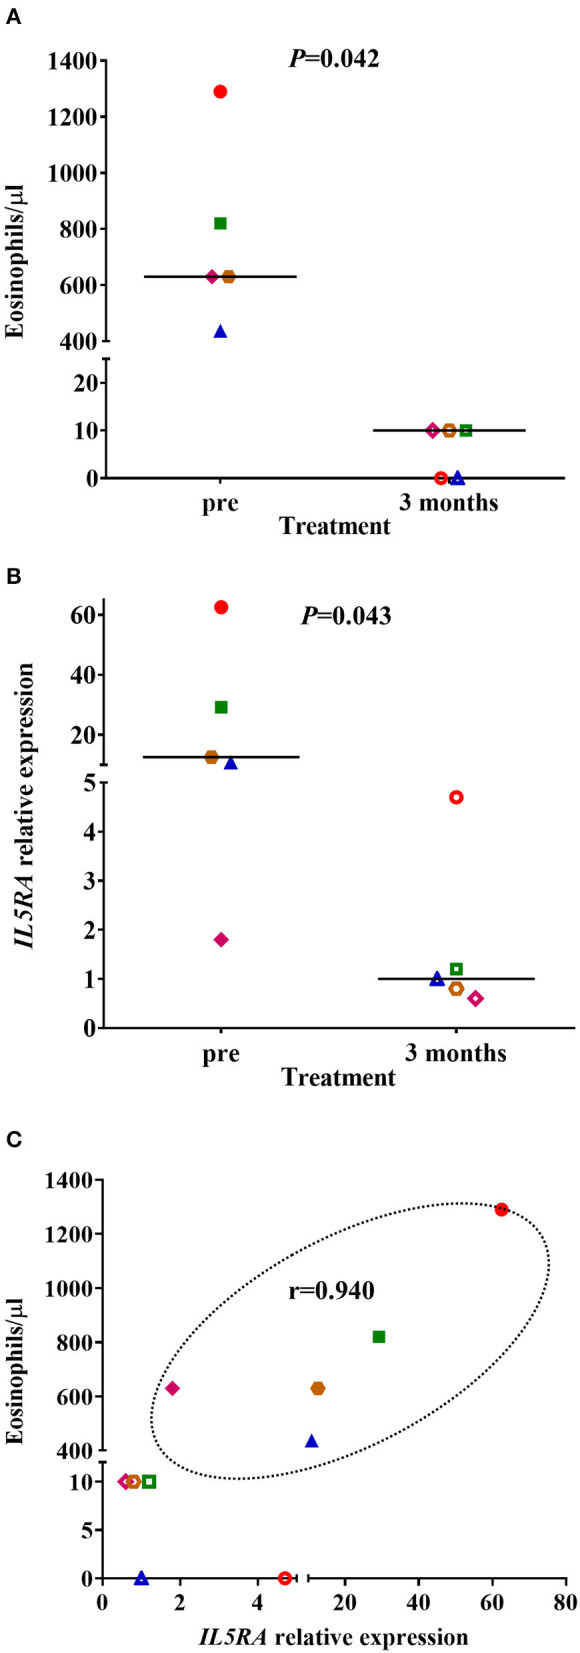
Figure 4.

(A) Peripheral blood eosinophil counts and (B)
IL5RA expression levels in pretreatment and after 3 months of benralizumab treatment. The median of each group is also shown. (C) Correlation between IL5RA expression levels and peripheral blood eosinophil counts at pretreatment and after 3 months of benralizumab treatment. Pearson's correlation coefficient in the pretreatment is also shown. Each symbol represents a patient ( Patient 1;
  Patient 2;
  Patient 3;
  Patient 4;
  Patient 5). The filled symbols correspond to the pretreatment and the empty symbols to after 3 months of benralizumab treatment.
