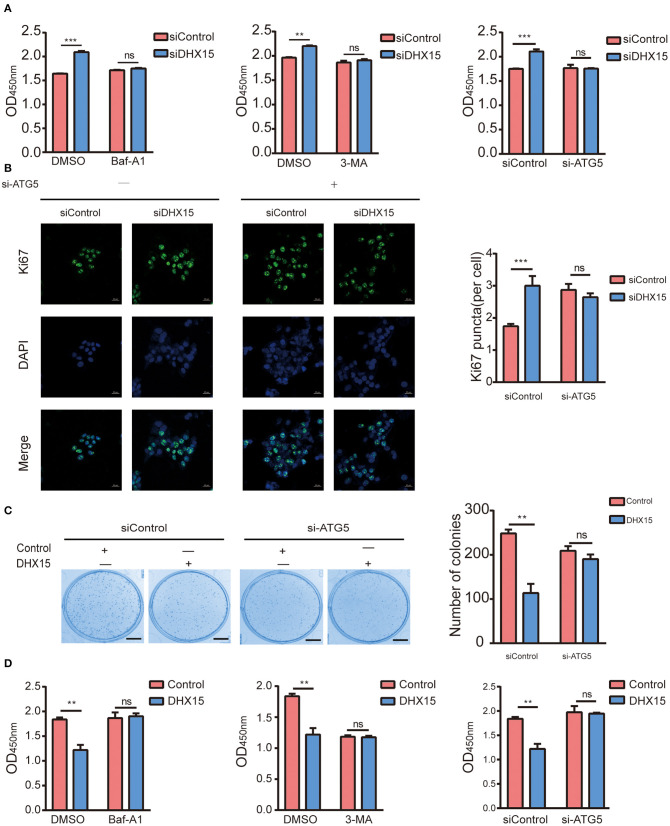
Figure 4.
DHX15 suppresses the growth of HCC cells by inhibiting autophagy. (A) The relative viability of DHX15-knockdown cells with or without autophagy inhibition was measured by CCK-8 assay. The data are presented as the mean ± SEM (n = 3). ***P < 0.001. (B) The Ki67-positive puncta in DHX15-knockdown HepG2 cells with or without ATG5 siRNA (si-ATG5) treatment were analyzed by immunofluorescence. Cellular nuclei were counterstained with DAPI. Representative images were obtained at 600× magnification. Scale bars: 20 μm. The graph shows the results of statistical analysis of the numbers of Ki67-positive puncta per cell. The data are presented as the mean ± SEM (n = 10). ***P < 0.001. (C) After HepG2 cells had been cotransfected with or without DHX15 and si-ATG5 and incubated for 12 days, colonies were stained with Coomassie brilliant blue and counted (scale bar: 5 mm). The data are the mean ± SEM (n = 3). **P < 0.01. (D) The relative viability of cells overexpressing DHX15 with or without autophagy inhibition was measured by CCK-8 assay. The data are presented as the mean ± SEM (n = 3). **P < 0.01.

