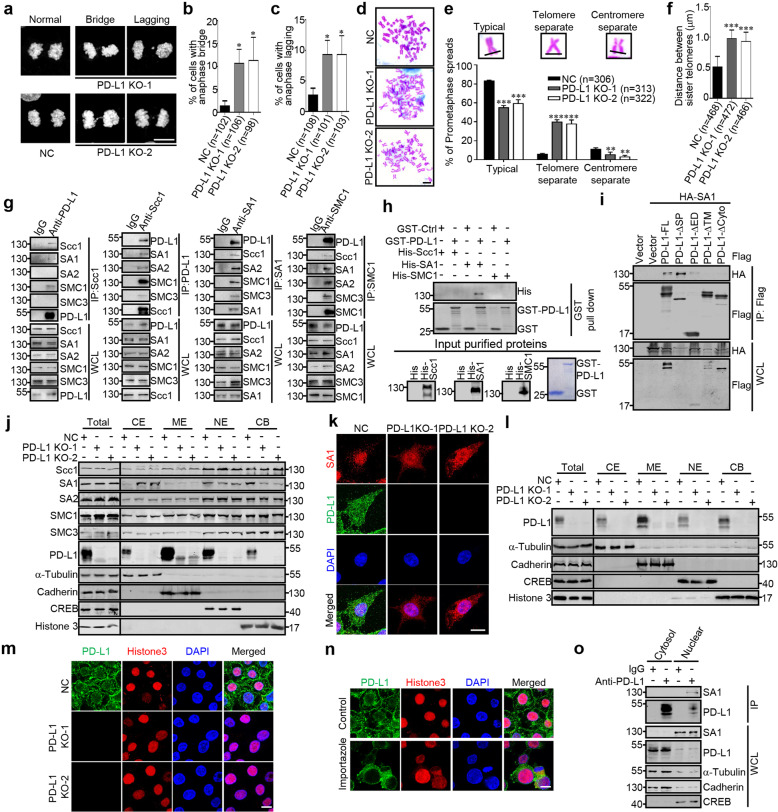
Fig. 1.
a–c Representative images of anaphase bridge and lagging chromosomes in negative control (NC) and PD-L1 knockout (KO) RKO cells a. The percentage of cells with anaphase bridge (b) and lagging (c) were counted. d The indicated cells were subjected to chromosome spread assay and followed by Giemsa staining after treatment with colcemid for 2.5 h. Scale bar: 10 μm. e Graphical representation of the frequency of each type of chromosome morphology. The classification was assigned when five or more chromosomes in a spread displayed the indicated morphology. The cells with different chromosomal morphology were counted. f Graphical representation of the distances between sister telomeres and the length was determined by Image J software. g Total lysates from RKO cells were subjected to co-IP analyses with antibodies against PD-L1, Scc1, SA1, or SMC1, respectively. h In vitro interactions of purified GST-PD-L1 with His-Scc1, His-SA1, and His-SMC1. Coomassie staining was used to visualize GST or His fusion proteins. Western analysis with anti-His was used to visualize His-fusion proteins. i HEK293T cells transfected with the indicated plasmids were used for co-IP experiments. j Fractionations of subcellular proteins form NC and PD-L1 KO RKO cells were analyzed by western blotting using the indicated antibodies. CE cytoplasmic extract, ME membrane extract, NE nucleoplasm extract, CB chromatin-bound nuclear extract. k Immunofluorescence analyses were carried out by using anti-PD-L1 and anti-SA1 antibodies. Scale bar, 10 μm. l Fractionations of subcellular proteins form NC and PD-L1 KO RKO cells were analyzed by western blotting using the indicated antibodies. m Immunostaining analyses were carried out by using anti-PD-L1 and anti-SA1 antibodies. Scale bar, 10 μm. n Wild-type RKO cells were treated with or without Importazole (1 μM) for 3 h, and subjected immunofluorescence assay with anti-PD-L1 and anti-Histone3 antibodies. Scale bar, 10 μm. o Wild-type RKO cells were isolated to cytosol (containing cytoplasmic and membrane proteins) and nuclear fractions, and processed for co-IP assay with anti-PD-L1 antibody. Quantitative data from at least three independent experiments are shown as the mean ± SD. The sample size (n) is indicated. ∗P < 0.05, ∗∗P < 0.01 and ∗∗∗P < 0.001, Student’s t-test

