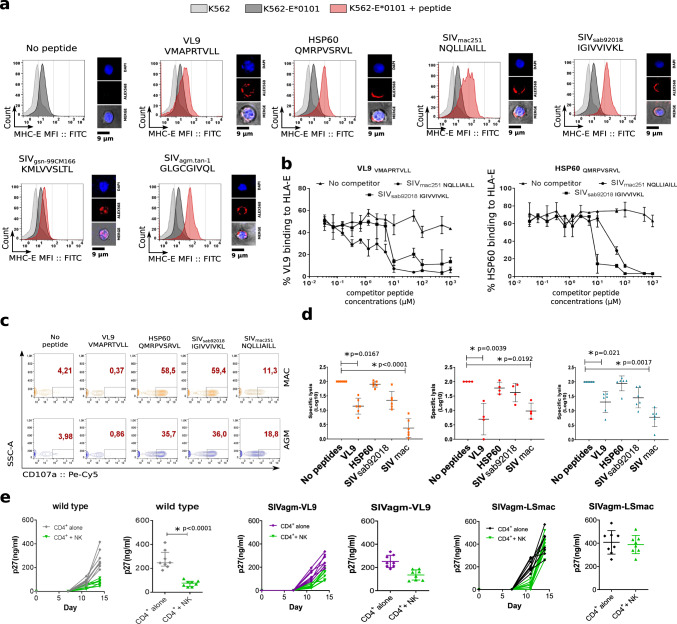
Fig. 7. Analysis of MHC-E restricted NK cell activity.
a Each histogram shows HLA-E expression after loading K562-E*0101 cells with the different peptides. Light gray curves indicate the mean fluorescent intensity (MFI) of HLA-E on K562 cells (control), the dark gray curves the MFI of HLA-E on K562-E*0101 cells without peptides, and the red curves the MFI of HLA-E on K562-E*0101 cells loaded with the given peptide. VL9 and HSP60 are control peptides well known to bind to MHC-E and deriving respectively from HLA-I and heat-shock protein. The SIVmac251 and SIVmac239 peptide sequences were identical. One representative experiment out of more than three is shown. On the right side are shown the localization of the peptide stained with Alexa 568 (red). Nuclei were stained with DAPI (blue). b Competition assay for binding to HLA-E. K562-E*0101 cells were loaded with biotin-A2 VL9 (left) or HSP60 peptides (right). An increasing concentration of the indicated unlabeled competitor peptides were introduced into the culture. HLA-E-bound biotinylated peptide was measured at the cell surface. line represent the median of three independent experiments. Error bars represents the range. c Analysis of HLA-E dependent activity of NK in presence of K562-E*0101 cells loaded or not with peptides. Activity was evaluated by CD107a cell surface expression. Dot plots show representative examples for one animal per species. d HLA-E dependent activity of NK cells from blood of six uninfected cynomolgus MAC (orange squares), four uninfected rhesus MAC (red circles) and six uninfected AGM (blue triangles) in the absence or presence of peptides, as indicated. The black line indicates the median and error bars the interquartile range. Each symbols represents a unique monkey. For Groups comparisons two-sided Wilcoxon signed-rank test with Bonferroni correction were used (n = 5). P values of less or equal to 0.05 were considered statistically significant. Asterix indicate significant change when compared to the base line. Exact P values are provide on the graphs. e SIV suppressive capacity of autologous NK cells depending on the ENV nonamer sequence in the infectious virus. The panels show in vitro replication levels of SIVagm.sab92018 (gray), SIVagm.sab92018 mutant with the sequence coding for the VL9 peptide (purple) and the SIVagm.sab92018 mutant with the sequence coding for the SIVmac nonamer peptide (black) in primary CD4+ T cells from 8 uninfected AGM cultured alone or in presence of autologous NK cells (green). For each of the three viruses, left panels show longitudinal viral replication pattern (days 0, 7, 11 and 15 p.i.) and right panels viral replication at the end time-point of the culture (day 15 p.i.). The y-axis reports viral replication level as quantified by SIV p27. The black line indicates the median and error bars the interquartile range. Significant difference between the two conditions was determind using using two-tail Mann–Whitney per experiment. Asterix indicate a statistically significant difference. The exact P value is provided.

