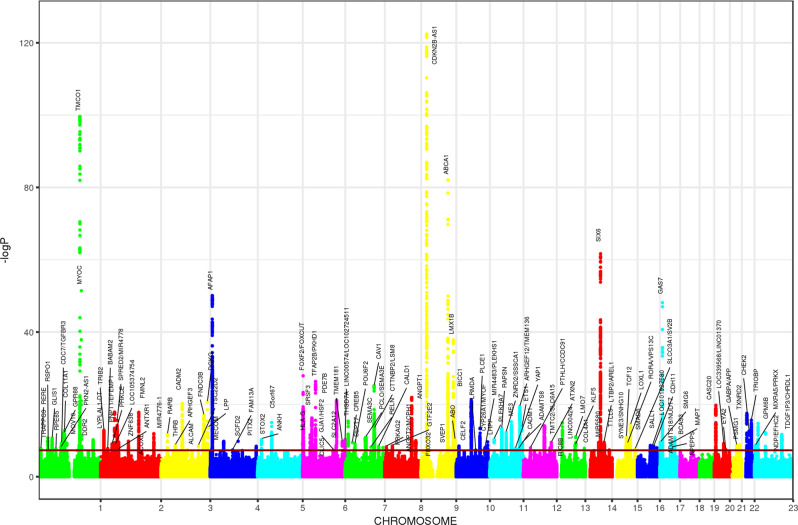
Fig. 3. Manhattan plots for the cross-ancestry meta-analysis.
Each dot represents a SNP, the x-axis shows the chromosomes where each SNP is located, and the y-axis shows −log10 P-value of the association of each SNP with POAG in the cross-ancestry meta-analysis (34,179 cases vs. 349,321 controls). The red horizontal line shows the genome-wide significant threshold (P-value = 5e-8; −log10 P-value = 7.30). The nearest gene to the most significant SNP in each locus has been labeled.

