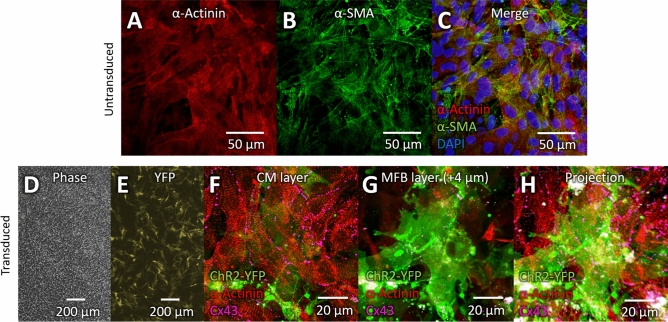
Figure 1.
Co-culture of cardiomyocytes and ChR2-transduced myofibroblasts. (A–C) Confocal image of co-culture of MFBs and CMs. α-actinin (A, red) marks CMs, and α-smooth muscle actin (B, α-SMA, green) marks MFBs. (C) Merge of (A) and (B) with DAPI (blue) to stain nuclei. (D) Phase-contrast image of CMs co-cultured with ChR2-MFBs. (E) Fluorescence image of same sample and area as in D, with YFP marking transduced MFBs. (F–H) Confocal images from 18 μm-thick z-stack of transduced MFBs and CMs. ChR2-YFP (green) marks transduced MFBs, α-actinin (red) marks CMs, and violet shows connexin43 (Cx43). ( F) CM layer of z-stack showing gap junctions between CMs. (G) Image from 4 μm above F showing MFBs on top of CMs, as well as Cx43 puncta, apparently between CMs and MFBs. (H) Maximum intensity projection of entire z-stack. Each layer of the z-stack is shown in Supplementary Fig. 1.

