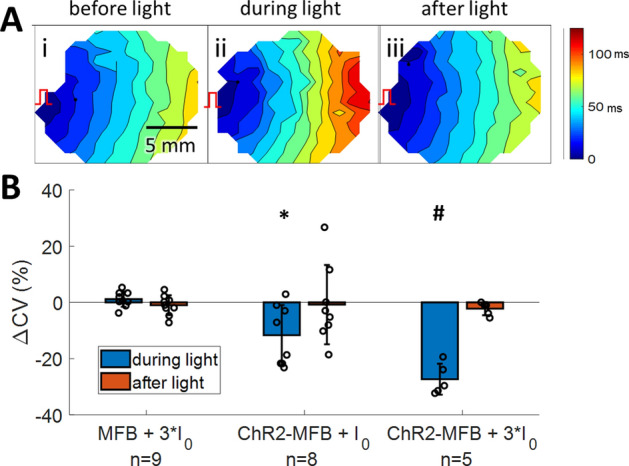
Figure 3.

Inward current in myofibroblasts causes slowing in co-cultured cardiomyocyte syncytia. (A) Activation maps of a co-culture of ChR2-MFBs with CMs before (i), during (ii), and after (iii) application of 3*I0 blue light to activate ChR2 current in MFBs. Color bar at right shows activation time scale. Isochrones are 10 ms apart. Red pacing marker illustrates location of pacing. (B) Percent change (from value prior to light application) in conduction velocity (CV) during and after application of light at different power levels during 500 ms CL pacing, for co-cultures of CMs with MFBs or ChR2-MFBs. Data for 10*I0 is not shown since almost all samples beat spontaneously with CL less than 500 ms at this intensity. * indicates p < 0.05, # indicates p < 0.005 between ChR2-MFB and MFB co-culture responses during light.
