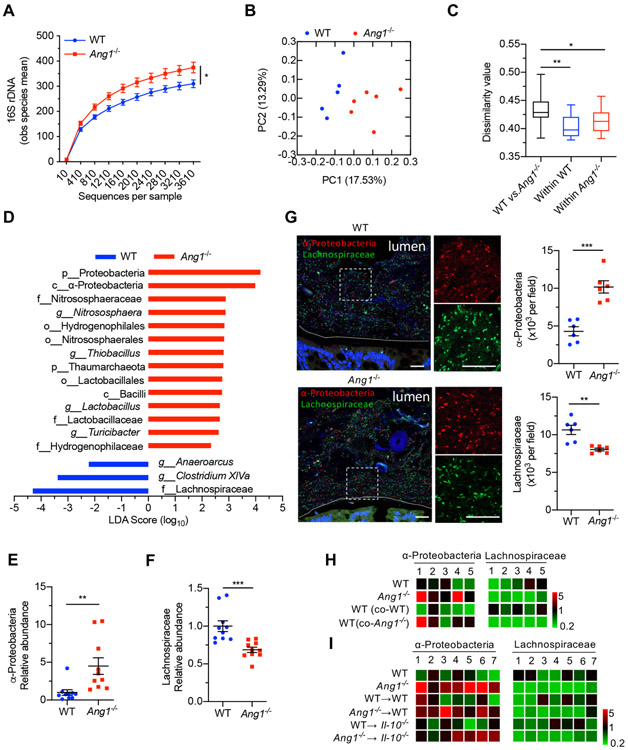
Figure 2.
Ang1 deficiency results in a dysbiotic microbiome. (A) High-throughput sequencing of 16S rDNA in faecal bacterial DNAs from WT (n=5) or Ang1−/− (n=6) mice. The Y-axis is the observed (obs) species mean, indicative of bacterial diversity. (B) Unweighted UniFrac principal-coordinate analysis of the β-diversity of microbiota composition in WT (n=5) or Ang1−/− (n=6) mice. (C) Quantification of unweighted UniFrac distance in (B). The five lines of boxplot from bottom to top represent the minimum value, the first quartile, median, the third quartile and the maximum value, respectively. (D) The most differentially abundant taxa of gut microbiota between WT and Ang1−/− mice. LDA Score: linear discriminant analysis score. (E and F) The abundance of α-Proteobacteria or Lachnospiraceae in the gut microbiota of WT or Ang1−/− mice, n=10. (G) FISH on colonic lumen sections from WT or Ang1−/− mice: α-Proteobacteria (red), Lachnospiraceae (green) and DNA (blue). Scale bar, 25 μm. At least five sections per group were analysed. (H and I) The relative bacterial abundance of α-Proteobacteria or Lachnospiraceae in mice from co-housing experiment (H) or FMT experiment (I). The heatmap represents the relative abundance of indicated bacterium in each mouse after normalised to the average of WT group. Data are presented as mean±SEM; *p<0.05; **p<0.01; ***p<0.001 by unpaired Student’s t-test (A, E–G) or analysis of similarities test (C). ANG, angiogenin; FISH, fluorescence in situ hybridisation; FMT, faecal microbiota transplantation; WT, wild-type.

