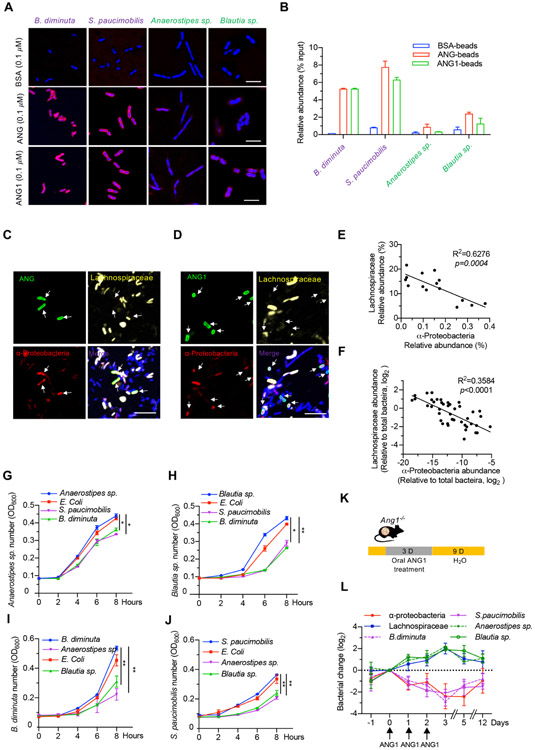
Figure 5.
ANG promotes Lachnospiraceae outgrowth at the expense of α-Proteobacteria. (A) Immunofluorescence staining of ANG, ANG1 or BSA in bacteria (B. diminuta, S. paucimobilis, Anaerostipes sp. or Blautia sp.) after treatment with 0.1 μM respective recombinant protein. Scale bar, 10 μm. (B) The relative binding ability of recombinant ANG, ANG1 or BSA with bacteria (B. diminuta, S. paucimobilis, Anaerostipes sp. or Blautia sp.) detected by pull-down assay. Results represent the relative enrichment of indicated bacterium after normalised to the input control. (C and D) Combined FISH with ANG (C) or ANG1 (D) immunostaining on human or mouse faecal smear slide. α-Proteobacteria (red), Lachnospiraceae (yellow), ANG or ANG1 (green) and DNA (blue). Scale bar, 25 μm. (E and F) Relationship between α-Proteobacteria and Lachnospiraceae in human (E, n=15) or mouse (F, n=45) gut microbiota. (G and H) Bacterial growth curve of Anaerostipes sp. (G) or Blautia sp. (H) after adding spent medium of E. coli (unrelated control), B. diminuta or S. paucimobilis. (I and J) Bacterial growth curve of B. diminuta (I) or S. paucimobilis (J) with spent medium of E. coli (unrelated control), Anaerostipes sp. or Blautia sp. (K) Scheme of oral ANG1 treatment in Ang1−/− mice for gut microbe analysis. (L) The relative abundance of indicated bacterium in ANG1-treated Ang1−/− mice at different time points, n=5. Data are normalised to the mice at Day 0. Data are presented as mean±SEM; *p<0.05; **p<0.01 by one-way ANOVA test (G–J) or linear regression analysis (E and F). ANG, angiogenin; ANOVA, analysis of variance; FISH, fluorescence in situ hybridisation.

