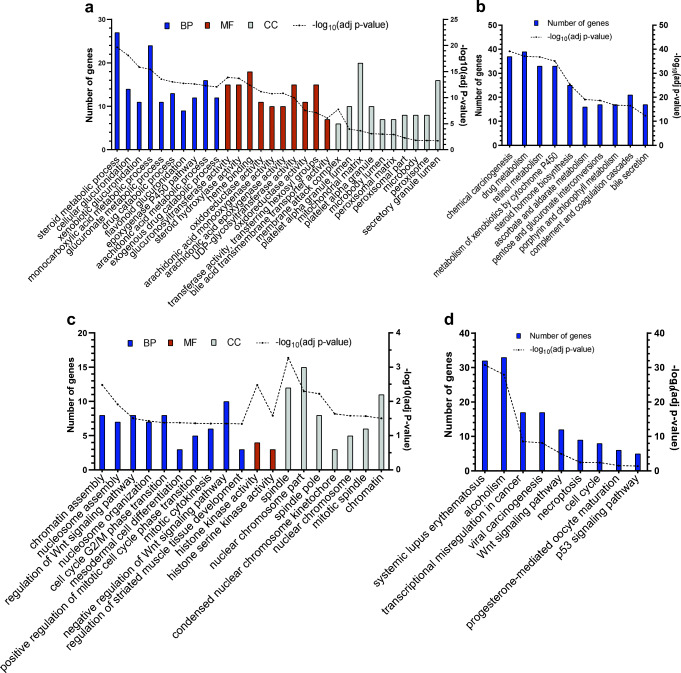
Fig. 1.
Gene Set Enrichment and Pathway Analyses of the down- (a, b) and up-regulated (c, d) genes. (a) and (c) indicate the top ten GO analysis results (if any) of the DEGs. (b) and (d) indicate the top ten KEGG pathway analysis results of the DEGs. BP: Biological Process, MF: Molecular Function, CC: Cellular Component

