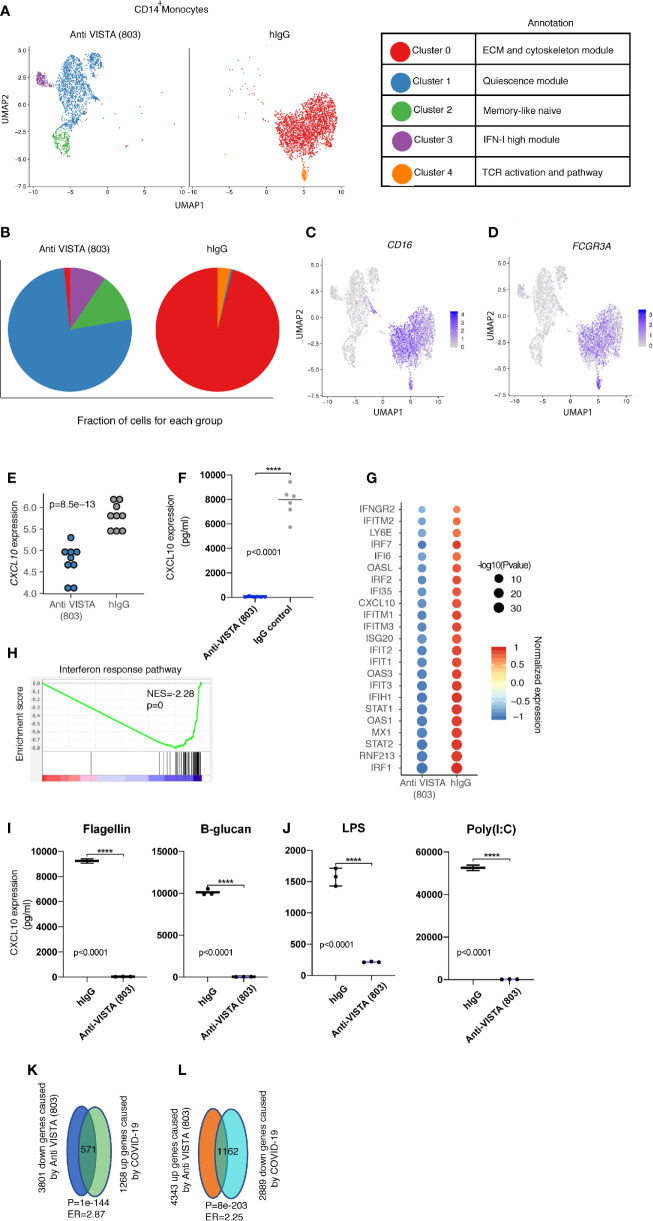
Figure 2.
Anti-VISTA agonist strikingly changes the CD14+ monocyte state and induces novel archetypes associated with the anti-inflammatory phenotype. (A) Uniform manifold approximation and projection (UMAP) plot showing the cluster distribution of Anti-VISTA (803) and hIgG2 isotype control treated CD14+ human monocytes. The biological annotation of each cluster is presented in the table on the right. (B) Pie chart indicating the composition of cluster difference in Anit-VISTA (803) and hIgG treated CD14+ human monocytes. (C, D) Feature plot showing the expression of Cd14 and Fcgr3a across different clusters in Anti-VISTA (803) and hIgG treated CD14+ human monocytes. (E) Dot plot depicting the CD14 gene expression difference between Anti-VISTA (803) and hIgG2 isotype control treated CD14+ human monocytes. (F) Human CD14+ monocytes were either treated with anti-VISTA agonist or hIgG2 isotype control for 24 h and CXCL10 supernatant levels was determined via multiplex analysis (G) Dot plot showing the interferon response associated genes difference between Anti-VISTA (803) and hIgG2 isotype treated CD14+ human monocytes. (H) GSEA plot showing the enrichment of interferon response pathway between Anti-VISTA (803) and hIgG2 treated CD14+ human monocytes. (I, J) Supernatant levels of CXCL10 determined by multiplex analysis after anti-VISTA agonist or control hIgG2 treatment of monocytes in the presence of Flagellin, B-glucan, LPS or Poly(I:C). (K, L) The Venn diagram showing the significant enrichment between Anti-VISTA (803) treated and COVID-19 CD14+ human monocytes. These experiments are representative of three independent repeat. ****p < 0.0001.

