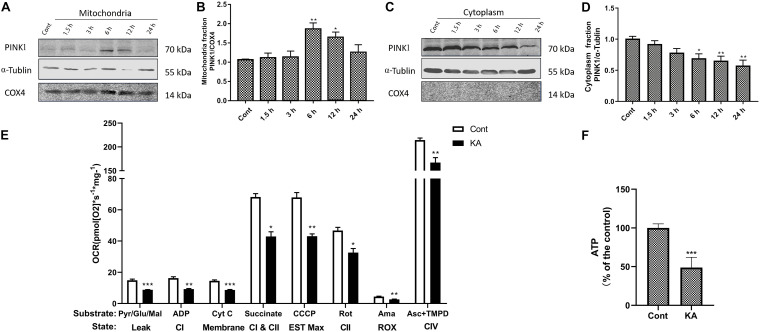
FIGURE 6.
KA induces mitochondria dysfunction in vivo. (A–D) Mice were given different doses of KA or treated for different periods of time. Representative bands and semi-quantitation of western blots for detecting PINK1 protein levels in the mitochondria fraction and cytoplasm fraction. (E) Mitochondrial respiratory parameters determined by O2K. The control group and the KA group were labeled with white and black columns, respectively. (F) Quantification of ATP concentration. Data are expressed as the Mean ± SEM. Scale bar = 500 μm (n = 8. *P < 0.05, **P < 0.01, and ***P < 0.001 vs control, one-way ANOVA, followed by a post hoc multiple comparison Student-Newman–Keuls test).

