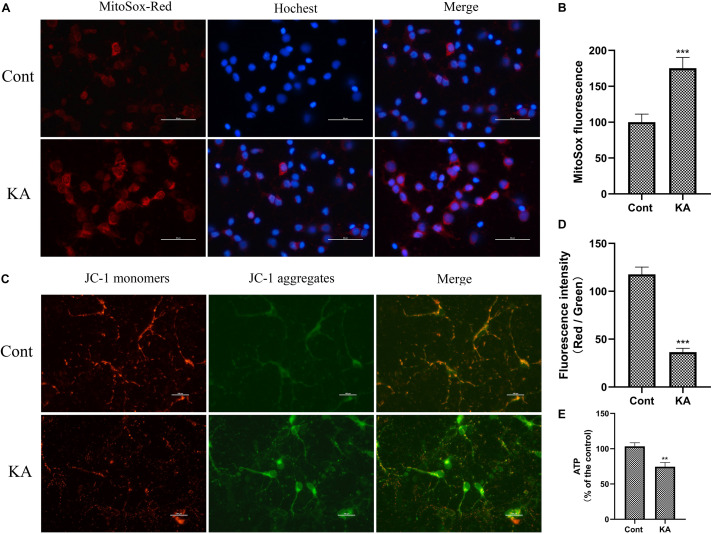
FIGURE 7.
KA induces mitochondria dysfunction in vitro. (A,B) MtROS was detected and quantified by MitoSOX Red probe. (C,D) Mitochondrial membrane potential was examined and quantified by JC-1 staining assays. (E) Quantification of ATP concentration. Data are expressed as the Mean ± SEM. Scale bar = 50 μm (n = 8. **P < 0.01, ***P < 0.001 vs control, one-way ANOVA, followed by a post hoc multiple comparison Student-Newman–Keuls test).

