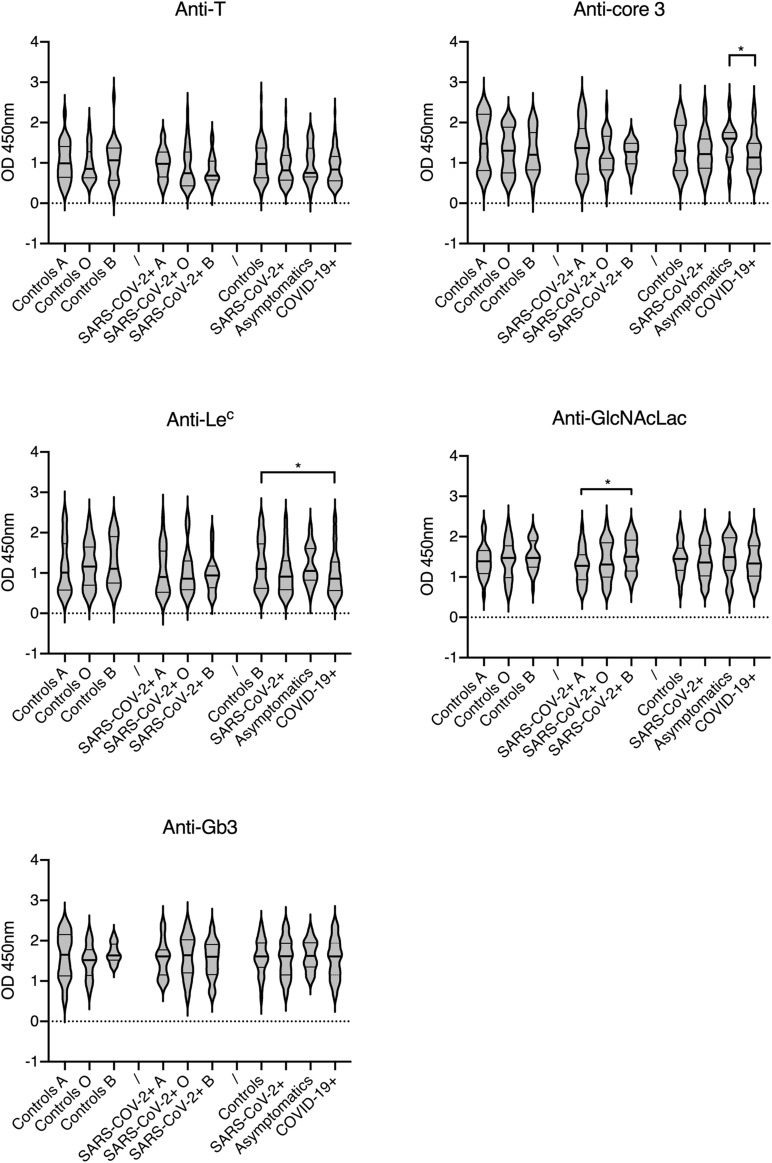
FIGURE 3.
Relationships between natural anti-carbohydrate antibodies, ABO phenotypes and infection status. Analyzed carbohydrate antigens are indicated on each panel. Antibodies levels are shown as OD450 nm values at 1: 30 plasma dilutions. Infected patients are defined as SARS-CoV-2 +, regardless of their clinical status or subdivided as asymptomatic and symptomatic COVID-19 +. Controls presented no sign of disease, were RT-PCR negative and anti-S negative. Plots show median values and quartiles (horizontal bars). P-values from Mann-Whitney between-groups comparisons are indicated: *p < 0.05.

