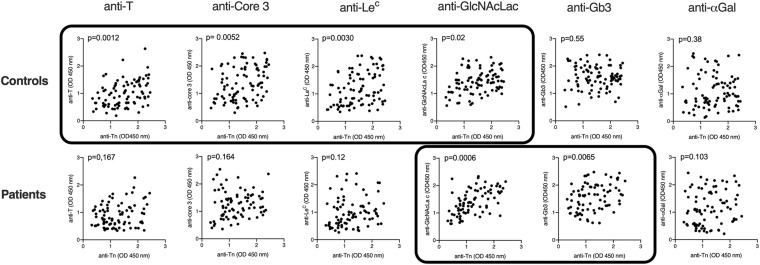
FIGURE 4.
Correlations between levels of anti-Tn natural antibodies and the other assayed natural anti-carbohydrate antibodies. Antibodies levels are shown as OD450 nm values at 1: 30 or 1: 50 (αGal) plasma dilutions. Correlations were assessed using Spearman r and two-tailed p-values after Holm correction for multiple testing are shown. Data sets with p-values <0.05 are boxed.

